- Polars - Home
- Polars - Installation
- Polars - Expressions And Contexts
- Polars - Lazy vs Eager API
- Polars - Data Stucture and Data Types
- Polars Useful Resources
- Polars - Useful Resources
- Polars - Discussion
Python Polars - Data Stucture and Data Types
Before we start working with data in polars using python, it is important to understand some basic concepts of polars library. In this chapter, we will cover all the important basic concepts of polars library. These concepts will help you easily work with data in the next chapters.
Polars can be quite helpful in fast and efficient data processing. To understand how Polars works, you first need to know a few basic things: DataFrame,series, dataypes and how it performs different operations on datasets. Once you understand these basic concepts clearly, you will be able to work easily with Polars library. Let's learn these concepts one by one.
What is a Series?
Polars library provides two main data structures: series and dataframes. A Series is a one-dimensional array in Polars where all values are of same data type(homogeneous). It represents a single column in a Polars DataFrame and allows to perform various operations on that column.
Example 1
In this example, we will create a Polars Series to see how it stores data in a single column.
import polars as pl

# Polars automatically infer data type as string
s1 = pl.Series("Fruits", ["Apple", "Banana", "Cherry"])
print(s1)
Let us compile and run the above program, this will produce the following result −
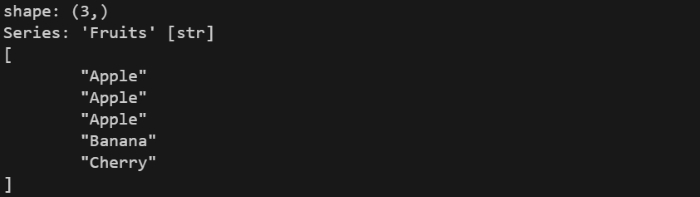
It automatically determines the data type based on given values. But, if we want, we can also specify a specific data type to override.
Example 2
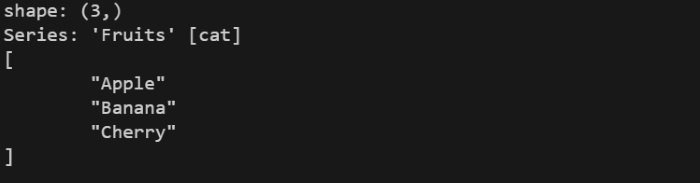
In this example, we will create a Polars Series to see how it stores data in a single column. We will also see how Polars override data type it if needed
import polars as pl

# Specify data type explicitly as categorical
s2 = pl.Series("Fruits", ["Apple", "Banana", "Cherry"], dtype=pl.Categorical)
print(s2)
Let us compile and run the above program, this will produce the following result −
What is DataFrame?
A DataFrame is a two-dimensional heterogeneous(different data type) data structure representing data as a table with rows and columns. Rows represent records, and columns represent fields. We can think of it like a spreadsheet. It contains uniquely named series, which represents a column in dataframe. By storing data in a DataFrame, you can use polars API to perform different queries to manipulte your data like filtering, transformations etc.
Example
In this example, we will create a small table or dataframe using Polars. This will help you understand how Polars stores data in columns and rows.
import polars as pl

# Creating a DataFrame with 7 columns and 7 rows
df = pl.DataFrame({
    "product": ["Laptop", "Phone", "Tablet", "Monitor", "Keyboard", "Mouse", "Headphones"],
    "brand": ["Dell", "Samsung", "Apple", "LG", "Logitech", "HP", "Sony"],
    "price": [60000, 30000, 20000, 15000, 2000, 800, 3500],
    "discount": [5000, 3000, 2500, 1200, 200, 50, 300],
    "stock": [10, 25, 15, 20, 50, 60, 40],
    "rating": [4.5, 4.2, 4.7, 4.1, 4.3, 4.0, 4.4],
    "category": ["Electronics", "Electronics", "Electronics", "Electronics", "Accessories", "Accessories", "Accessories"]
})

print(df)
Let us compile and run the above program, this will produce the following result −
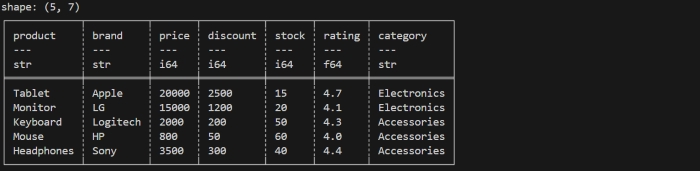
It will create a dataframe as shown in below image −
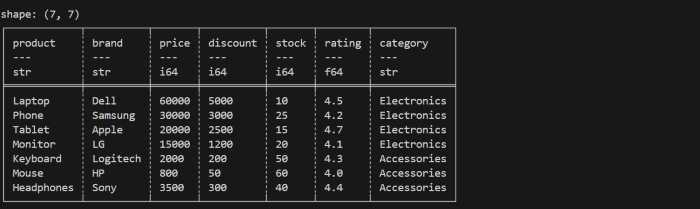
Explanation − In the above program, we first import the Polars library using import polars as pl so that we can use its DataFrame features. Then we create a DataFrame by passing a dictionary to pl.DataFrame(), where each key becomes a column name and each list becomes the column's values.
Then when we print the dataframe, it displays data in tabular form. First, it shows the shape, which tells you how many rows and columns are present in DataFrame. After that, it shows tabular form data with the column names and each column's contain its datatype (such as str for text or i64 for integers).
Inspecting a DataFrame in Polars Using Python
Before performing any analysis, it is important to first look at your data and understand what it contains. Polars provides several built-in important methods that help us inspect and understand about our data.
Let's see below mentioned some methods to inspect a dataframe and they are as −
- Head Method
- Tail Method
- Glimpse Method
- Sample Method
- Describe Method
- Schema Attribute
Head Method
When you write dataframe.head(), it returns the first few or n rows of your DataFrame. By default, it returns the first five(5) rows. But you can also specify inside this method the number of rows you want. If you pass a negative number n, it will return all the rows except the last n rows.
Lets understand it through below code. We will use the same DataFrame that we created above. Now, we will apply .head() method on that dataframe.
print(df.head(3))
It will display the first 3 rows of dataframe as shown in below image −
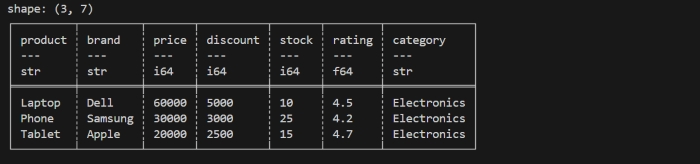
When you do not pass any value inside .head() method then by default, it will display first five rows only.
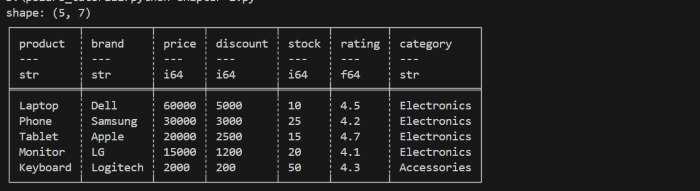
print(df.head())
It will display the first 5 rows of dataframe as shown in below image −
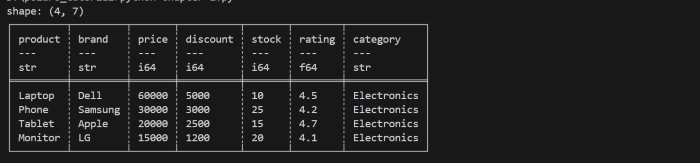
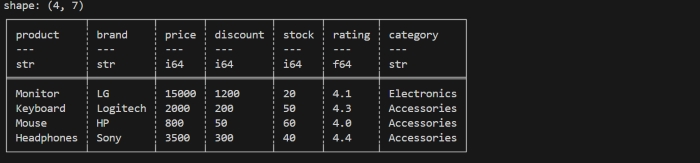
If you pass a negative value, it will display all rows except last n rows.
print(df.head(-3))
It will display the all rows except the last 3 rows as shown in below image −
Tail Method
.tail() method display the last rows of a dataframe. By default, it returns the last five(5) rows. But you can also specify inside this method the number of rows you want. If you pass a negative number n, it will return all the rows except the first n rows.
Lets understand it through below code. We will use the same DataFrame that we created above. Now, we will apply .tail() method on that dataframe.
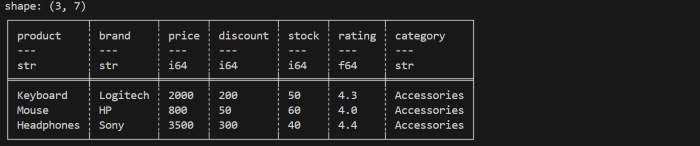
print(df.tail(3))
It will display the last 3 rows of dataframe as shown in below image −
When you do not pass any value inside .tail() method then by default, it will display last five rows only.
print(df.tail())
It will display the last 5 rows of dataframe as shown in below image −
If you pass a negative value, it will display all rows except first n rows.
print(df.tail(-3))
It will display the all rows except the first 3 rows as shown in below image −
Glimpse Method
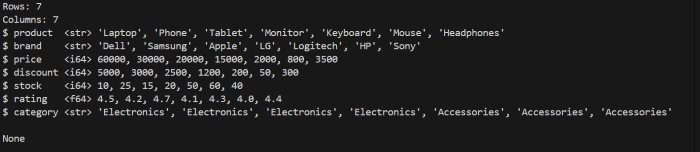
.glimpse() method is polars dataframe method that provides a overview of dataset. It display the column names, datatypes of column and values of each column. But this method is only available in python API not in rust.
Lets understand it through below code. We will use the same DataFrame that we created above. Now, we will apply .glimpse() method on that dataframe.
print(df.glimpse())
It will display the following dataframe −
Sample Method
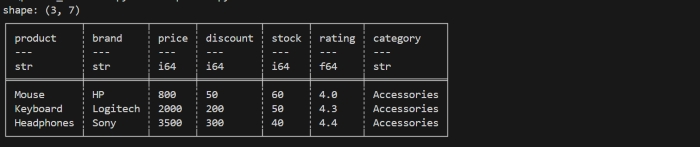
.sample() is a method of polars dataframe that returns random selection of rows from dataframe. We can pass the number of rows we want. Since the selection is random, the order of the returned rows may not match the original order in the DataFrame.
Lets understand it through below code. We will use the same DataFrame that we created above. Now, we will apply .sample() method on that dataframe.
print(df.sample(3))
It will display the random 3 rows of dataframe as shown in below image −
Describe Method
.describe() method is a polars DataFrame method that returns the summary statistics for each numerical column of the dataframe. It return values like count, mean minimun, maximum, standard deviation etc. In other words we can say, this method gives the overall distribution of data.
Lets understand it through below code. We will use the same DataFrame that we created above. Now, we will apply .sample() method on that dataframe.
print(df.describe())
It will display the distribution of data as shown in below image −
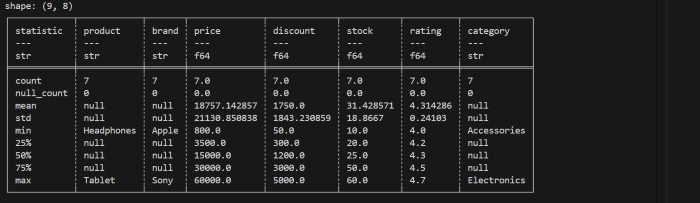
Here's what each row returned from .describe() means:
- count is the number of observations or rows in the dataset.
- null_count is the number of missing values in the column.
- mean is the arithmetic mean, or average, of the column.
- std is the standard deviation of the column.
- min is the minimum value of the column.
- max is the maximum value of the column.
- 50% is the median value or fiftieth percentile of the column.
- 25% is the twenty-fifth percentile, or first quartile, of the column.
- 75% is the seventy-fifth percentile, or third quartile, of the column.
Schema Attribute
.schema is a Polars DataFrame attribute that provides the blueprint of your data. It returns the column names along with their data types. It helps us to understand the structure of data. Polars automatically determines the schema when you create a DataFrame, but you can override it if needed.
Lets understand it through below code. We will use the same DataFrame that we created above. Now, we will apply .schema method on that dataframe.
print(df.schema)
It will display the structure of data as shown in below image −

How Polars Stores Data Internally?
Polars stores data column-wise not row-wise. It means all values of one column will store togeteher in memory. By doing this, it makes computation fast and saves memory. Polars uses Apache Arrow format(columnar behaviour) internally.
Data Types in Polars
Polars supports a wide range of data types and they are as −
- Numeric Datatype − Integers(signed and unsigned), floating numbers(float32, float64), decimal numbers(128-bit decimal type).
- Boolean Datatype − It is used for true or false values.
- Temporal Datatype − dates,times and datetimes.
- Text/String Datatype − unique text data(Utf8)
- Categorical Datatype − It stores repeated text values only once which saves memory.
- Nested Datatype − It supports also nested datatype like list or arrays, and allows to store more than one value in a single cell of a dataframe.
Polars also supports missing values using null, which is different from NaN which is used in floating-point numbers.
Example
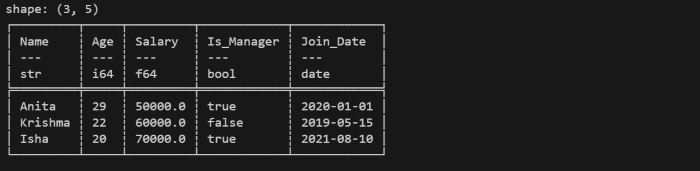
In this example, we will create a DataFrame in Polars using python with different types of data including numbers, text, booleans, and dates. This will help you see how Polars stores and handles multiple data types in a single table.
import polars as pl
from datetime import date

df = pl.DataFrame({
    "Name": ["Anita", "Krishma", "Isha"],      # Utf8/String
    "Age": [29, 22, 20],                      # Int64
    "Salary": [50000.0, 60000.0, 70000.0],   # Float64
    "Is_Manager": [True, False, True],        # Boolean
    "Join_Date": [date(2020, 1, 1), date(2019, 5, 15), date(2021, 8, 10)]  # Date
})

print(df)
Let us compile and run the above program, this will produce the following result −
It will create a dataframe as shown in below image −