
Article Categories
- All Categories
-
 Data Structure
-
 Networking
-
 RDBMS
RDBMS
-
 Operating System
-
 Java
Java
-
 MS Excel
-
 iOS
iOS
-
 HTML
HTML
-
 CSS
CSS
-
 Android
-
 Python
-
 C Programming
-
 C++
C++
-
 C#
C#
-
 MongoDB
-
 MySQL
MySQL
-
 Javascript
-
 PHP
PHP
-
 Economics & Finance
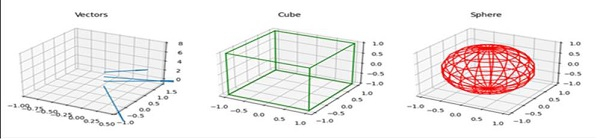
Plotting a 3d cube, a sphere and a vector in Matplotlib
Get fig from plt.figure() and create three different axes using add_subplot, where projection=3d.
Set up the figure title using ax.set_title("name of the figure"). Use the method ax.quiver to plot vector projection, plot3D for cube, and plot_wireframe for sphere after using sin and cos.
Steps
Create a new figure, or activate an existing figure.
To draw vectors, get a 2D array.
Get a zipped object.
Add an ~.axes.Axes to the figure as part of a subplot arrangement, with 3d projection, where nrows = 1, ncols = 3 and index = 1.
Plot a 3D field of arrows.
Set xlim, ylim and zlim.
Set the title of the axis (at index 1).
Add an ~.axes.Axes to the figure as part of a subplot arrangement, with 3d projection, where nrows = 1, ncols = 3 and index = 2.
Create a surface plot using plot3D(), where the surface and edge are being passed with color green.
Set the title of the axis (at index 2). i.e., “Cube”.
Add an ~.axes.Axes to the figure as part of a subplot arrangement, with 3d projection, where nrows = 1, ncols = 3 and index = 3.
To make the sphere get sin and cos curves together at the same position.
Set the title of the axis (at index 3), i.e., “Sphere”.
To show the plot, use plt.show() method.
Example
import matplotlib.pyplot as plt
import numpy as np
from itertools import product, combinations

fig = plt.figure()

# draw vector
soa = np.array([[0, 0, 1, 1, -2, 0], [0, 0, 2, 1, 1, 0],
               [0, 0, 3, 2, 1, 0], [0, 0, 4, 0.5, 0.7, 0]])

X, Y, Z, U, V, W = zip(*soa)
ax = fig.add_subplot(131, projection='3d')
ax.quiver(X, Y, Z, U, V, W)
ax.set_xlim([-1, 0.5])
ax.set_ylim([-1, 1.5])
ax.set_zlim([-1, 8])
ax.set_title("Vectors")

# draw cube
ax = fig.add_subplot(132, projection='3d')
r = [-1, 1]
for s, e in combinations(np.array(list(product(r, r, r))), 2):
   if np.sum(np.abs(s-e)) == r[1]-r[0]:
      ax.plot3D(*zip(s, e), color="green")
ax.set_title("Cube")

# draw sphere
ax = fig.add_subplot(133, projection='3d')
u, v = np.mgrid[0:2*np.pi:20j, 0:np.pi:10j]
x = np.cos(u)*np.sin(v)
y = np.sin(u)*np.sin(v)
z = np.cos(v)
ax.plot_wireframe(x, y, z, color="red")
ax.set_title("Sphere")

plt.show()
Output

5K+ Views
