
Article Categories
- All Categories
-
 Data Structure
-
 Networking
-
 RDBMS
RDBMS
-
 Operating System
-
 Java
Java
-
 MS Excel
-
 iOS
iOS
-
 HTML
HTML
-
 CSS
CSS
-
 Android
-
 Python
-
 C Programming
-
 C++
C++
-
 C#
C#
-
 MongoDB
-
 MySQL
MySQL
-
 Javascript
-
 PHP
PHP
-
 Economics & Finance
Selected Reading
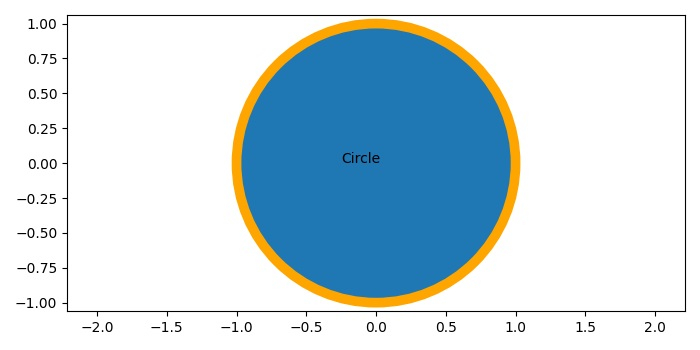
Plot a circle with an edgecolor in Matplotlib
To plot a circle with an edgecolor in matplotlib, we can take the following Steps −
Create a new figure or activate an existing figure using figure() method.
Add a subplot method to the current axis.
Create a circle instance using Circle() class with an edgecolor and linewidth of the edge.
Add a circle path on the plot.
To place the text in the circle, we can use text() method.
Scale the X and Y axes using xlim() and ylim() methods.
To display the figure, use show() method.
Example
import matplotlib
from matplotlib import pyplot as plt, patches
plt.rcParams["figure.figsize"] = [7.00, 3.50]
plt.rcParams["figure.autolayout"] = True
fig = plt.figure()
ax = fig.add_subplot(111)
circle = matplotlib.patches.Circle((0, 0), radius=1, edgecolor="orange", linewidth=7)
ax.add_patch(circle)
plt.text(-.25, 0, "Circle")
plt.xlim([-4, 4])
plt.ylim([-4, 4])
plt.axis('equal')
plt.show()
Output

Updated on: 2021-05-15T12:46:06+05:30
3K+ Views

Advertisements