
 Data Structure
 Networking
 RDBMS
RDBMS Operating System
 Java
Java MS Excel
 iOS
iOS HTML
HTML CSS
CSS Android
 Python
 C Programming
 C++
C++ C#
C# MongoDB
 MySQL
MySQL Javascript
 PHP
PHP
- Selected Reading
- UPSC IAS Exams Notes
- Developer's Best Practices
- Questions and Answers
- Effective Resume Writing
- HR Interview Questions
- Computer Glossary
- Who is Who
Placing plot on Tkinter main window in Python
Oftentimes, we need to deal with plots in our Tkinter GUI-based application. To support the plots for the available data points, Python provides a Matplotlib package that can be imported into the application easily. In order to add a plot for the given data points, we have to install several other packages such as NumPy along with Matplotlib. NumPy is a Python library that helps to deal with scientific calculation in the Data.
Example
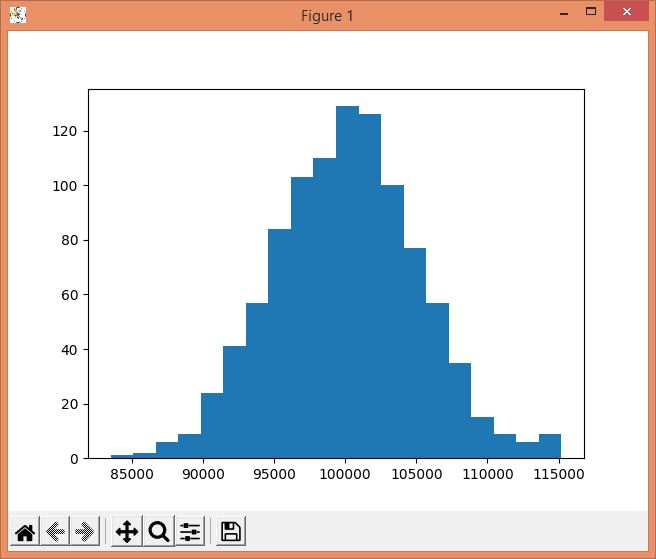
In this example, we will create data points for the car prices starting from (100000) with the units in the range of 1000 to 5000.
#Import the required Libraries
from tkinter import *
import numpy as np
import matplotlib.pyplot as plt

#Create an instance of Tkinter frame
win= Tk()

#Set the geometry of tkinter frame
win.geometry("750x250")

def graph():
   car_prices=np.random.normal(100000, 5000, 1000)
   plt.hist(car_prices, 20)
   plt.show()

#Create a button to show the plot
Button(win, text= "Show Graph", command= graph).pack(pady=20)
win.mainloop()
Output
If we will run the above code, it will display a window that contains a button "Show Graph".

When we click the button, it will display the graph on the screen.

Updated on: 2021-05-03T11:39:14+05:30
3K+ Views

Advertisements