
Article Categories
- All Categories
-
 Data Structure
-
 Networking
-
 RDBMS
RDBMS
-
 Operating System
-
 Java
Java
-
 MS Excel
-
 iOS
iOS
-
 HTML
HTML
-
 CSS
CSS
-
 Android
-
 Python
-
 C Programming
-
 C++
C++
-
 C#
C#
-
 MongoDB
-
 MySQL
MySQL
-
 Javascript
-
 PHP
PHP
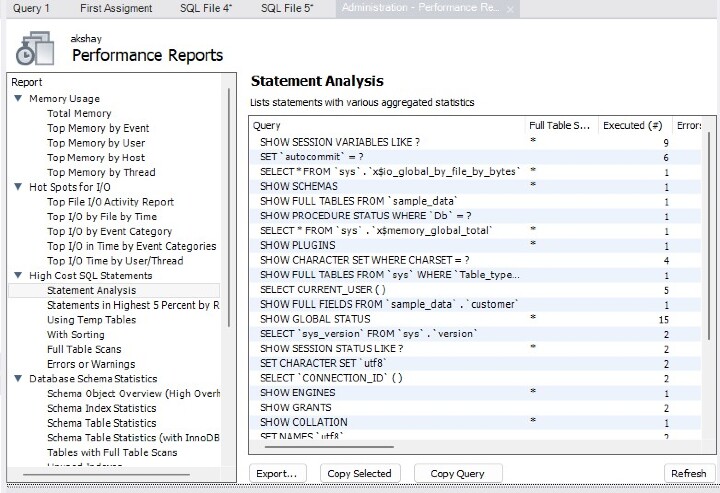
Performance Report Controls in Mysql Workbench
The controls listed below can be used to examine and export performance report data (see the following figure) ?
Export ? Export all entries from the current performance report, including all queries and values, together with any associated data (including column headings). opens an export file dialogue.
Copy Selected ? Copies a single entry from the current performance report together with any related data (and column titles). the system's clipboard is saved. a case in point
Query Copy ? This function copies the SQL statement that produced the performance report. the system clipboard is saved.
Refresh ? The performance report is refreshed (reloaded).
Performance Report Descriptions
Reports on Performance: Statement Analysis
The following groupings are shown for individual reports ?
Memory Usage
Total Memory ? Shows total memory allocated.
Top Memory by Event ? Shows events consuming the most memory.
Top Memory by User ? Shows users consuming the most memory
Top Memory by Host ? Shows hosts consuming the most memory.
Top Memory by Thread ? Shows threads consuming the most memory.
Hot Spots for I/O
Top File I/O Activity Report ? Shows the files with the most I/O usage in bytes.
Top I/O by File by Time ? Shows the highest I/O usage by file and latency.
Top I/O by Event Category ? Shows the highest I/O data usage by event categories.
Top I/O in Time by Event Categories ? Shows the highest I/O time consumers by event categories.
Top I/O by User/Thread ? Shows the top I/O time consumers by user and thread.
High-Cost SQL Statements
Statement Analysis ? Lists statements with various aggregated statistics.
Statements in the Highest 5 percent by Runtime ? Lists all statements in which the average runtime (in microseconds) is in the highest five percent.
Using Temp Tables ? Lists all statements that use temporary tables (access the highest percentage of disk temporary tables, then memory temporary tables).
With Sorting ? Lists all normalized statements that have done sorts (access in the following priority order: sort_merge_passes, sort_scans, and sort_rows).
Full Table Scans ? Lists statements that have performed a full table scan. Access query performance and the WHERE clause (or clauses). If no index is used, consider adding indexes for large tables.
Errors or Warnings ? Lists statements that have raised errors or warnings.
Database Schema Statistics
Schema Object Overview (High Overhead) ? Shows the count by object for each schema. Note that for instances with a large number of objects, this report may require extended time to execute.
Schema Index Statistics ? Shows the general statistics related to indexes.
Schema Table Statistics ? Shows the general statistics related to tables.
Schema Table Statistics (with InnoDB buffer) ? Shows schema tables with InnoDB buffer statistics.
Tables with Full Table Scans ? Finds tables that are being accessed by full table scans, ordering by the number of rows scanned (descending).
Unused Indexes ? Shows the list of indexes that were never used since the server started or since P_S data collection started.
Wait Event Times (Expert)
Global Waits by Time ? Lists the top global wait events by their total time, ignoring idle (this may not be very large).
Waits by User by Time ? Lists the top wait events by user and by their total time, ignoring idle (this may not be very large).
Wait Classes by Time ? Lists the top wait classes by total time, ignoring idle (this may not be very large).
Waits Classes by Average Time ? Lists the top wait classes by average time, ignoring idle (this may not be very large).
InnoDB Statistics
InnoDB Buffer Stats by Schema ? Summarizes the output of the INFORMATION_SCHEMA.INNODB_BUFFER_PAGE table, aggregating by the schema.
InnoDB Buffer Stats by Table ? Summarizes the output of the INFORMATION_SCHEMA.INNODB_BUFFER_PAGE table, aggregating by schema and table name.
User Resource Use
Overview ? Shows the resource use summary for each user.
I/O Statistics ? Shows the I/O use for each user.
Statement Statistics ? This shows the statement execution statistics for each user.
Conclusion
In this article, we have learned about different Performance report control and how to get them using mysql workbench.

794 Views
