
Article Categories
- All Categories
-
 Data Structure
-
 Networking
-
 RDBMS
RDBMS
-
 Operating System
-
 Java
Java
-
 MS Excel
-
 iOS
iOS
-
 HTML
HTML
-
 CSS
CSS
-
 Android
-
 Python
-
 C Programming
-
 C++
C++
-
 C#
C#
-
 MongoDB
-
 MySQL
MySQL
-
 Javascript
-
 PHP
PHP
-
 Economics & Finance
Selected Reading
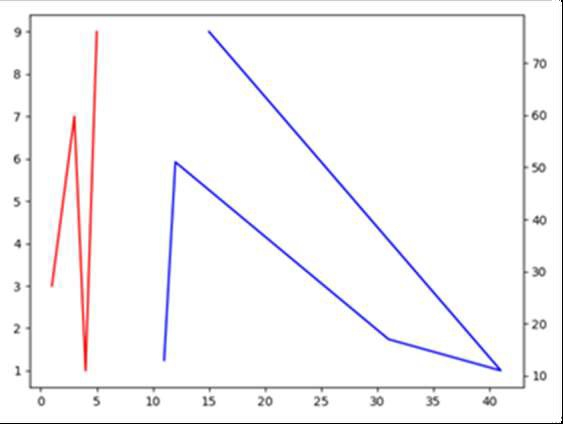
Multiple axes in Matplotlib with different scales
In the following code, we will see how to create a shared Y-axis.
Steps
Create fig and ax variables using subplots method, where default nrows and ncols are 1.
Plot line with lists passed in the argument of plot() method with color="red".
Create a twin of Axes with a shared X-axis but independent Y-axis.
Plot the line on ax2 that is created in step 3.
Adjust the padding between and around subplots.
To show the figure use plt.show() method.
Example
import matplotlib.pyplot as plt
fig, ax1 = plt.subplots()
ax1.plot([1, 2, 3, 4, 5], [3, 5, 7, 1, 9], color='red')
ax2 = ax1.twinx()
ax2.plot([11, 12, 31, 41, 15], [13, 51, 17, 11, 76], color='blue')
fig.tight_layout()
plt.show()
Output

Updated on: 2021-03-17T07:55:01+05:30
4K+ Views

Advertisements