
Article Categories
- All Categories
-
 Data Structure
-
 Networking
-
 RDBMS
RDBMS
-
 Operating System
-
 Java
Java
-
 MS Excel
-
 iOS
iOS
-
 HTML
HTML
-
 CSS
CSS
-
 Android
-
 Python
-
 C Programming
-
 C++
C++
-
 C#
C#
-
 MongoDB
-
 MySQL
MySQL
-
 Javascript
-
 PHP
PHP
-
 Economics & Finance
Minimum Bottleneck Spanning tree(MBST)
The Minimum Bottleneck Spanning tree is an undirected graph whose highest weight is considered as minimum as possible.
Let?s take an example to understand the Minimum Bottleneck Spanning tree.
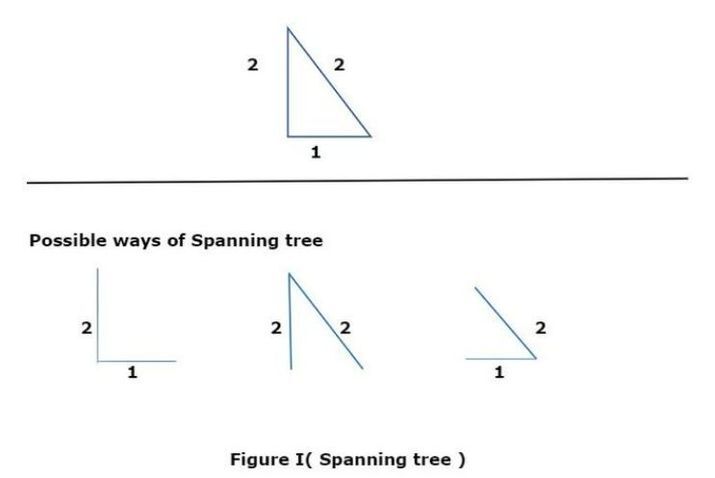
In Figure I, we observe that there are three possible ways of spanning trees that have the common edge 2 and it means there is no other tree having a bottleneck value less than 2. Therefore, all these trees verify as Minimum Bottleneck Spanning trees.
How we can say that the MST is MBST?
There are the following points to understand the MST to be MBST ?
MBST is not technically a minimum spanning tree.
The greatest edge with the highest edge weight is the Minimum Bottleneck Spanning tree.
The Minimum Spaning tree must be MBST.
MBST has a total weight greater than the minimum spanning tree.
In this article, we are going to understand the Minimum Bottleneck Spanning tree in depth.
Example 1
Let the G be a given rectangle graph and find all possible spanning trees as possible.
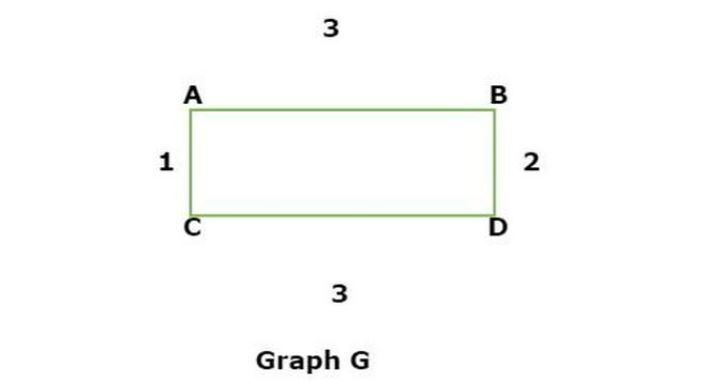
Now we have to find the total possible ways of spanning trees such as ?
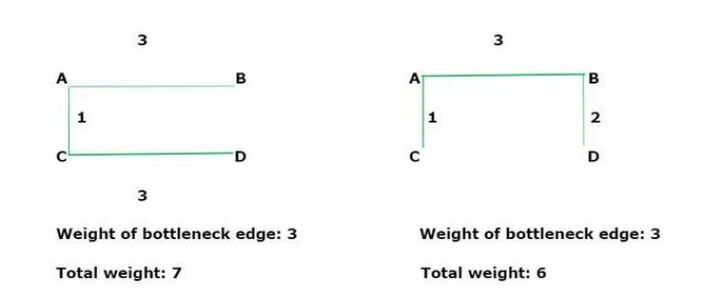
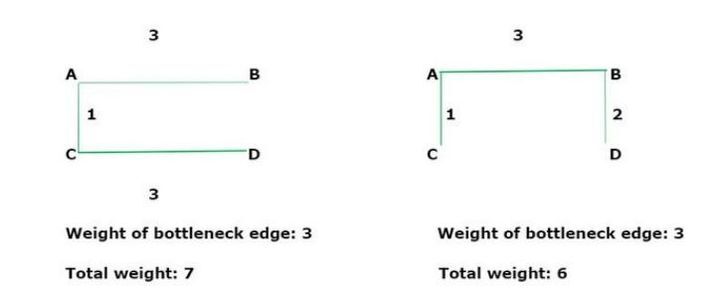
We see there are possibilities of 4 spanning trees that illustrate the different forms of given undirected graphs. By doing all these spanning, there is one spanning tree having a weight of 6. All the spanning trees for the specified graph are Minimum Bottleneck Spanning Trees as they all have the same value for the bottleneck edge. However, only two of the spanning trees have overall weights that are minimum(6), and the rest of them are not minimum spanning trees.
How MBST( Minimum Bottleneck Spanning Tree) is different from MST ( Minimum Spanning Tree )?
Now let?s take three following pictures to understand the differences between MST and MBST
There are the following points to understand all these spanning graphs ?
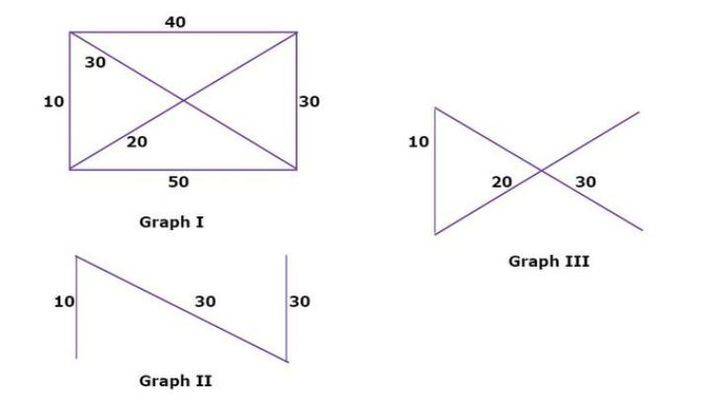
The given Graph I represents the original graph and the total weight (10+40+30+50+30+20) is 180.
-
To find the MST of the graph, we separate the two graphs namely Graph II and Graph III.
The minimum weight of Graph II (10+30+30) is 70.
The minimum weight of Graph III ( 10+20+30 ) is 60.
Hence, the result of Graph III shows the best possible minimum spanning tree.
-
The Graph II represents the MBST whereas Graph III represents the MST.
Therefore, the MST must be MBST whereas the MBST is not always considered to be MST.
Conclusion
We explored the concept of the Minimum Bottleneck Spanning tree which represents a graph in different forms by giving the highest weight of an edge. We saw two examples that give better clarity of MST vs MBST. The real application of MBST is telecommunication, supply chain system, water supply network, etc.

1K+ Views
