- Logstash - Home
- Logstash - Introduction
- Logstash - ELK Stack
- Logstash - Installation
- Logstash - Internal Architecture
- Logstash Parse and Transform
- Logstash - Parsing the Logs
- Logstash - Filters
- Logstash - Transforming the Logs
- Logstash Output Stage
- Logstash - Output Stage
- Logstash - Supported Outputs
- Logstash Advanced Topics
- Logstash - Plugins
- Logstash - Monitoring APIs
- Logstash - Security and Monitoring
- Logstash Useful Resources
- Logstash - Quick Guide
- Logstash - Useful Resources
- Logstash - Discussion
Logstash - Internal Architecture
In this chapter, we will discuss regarding the internal architecture and the different components of Logstash.
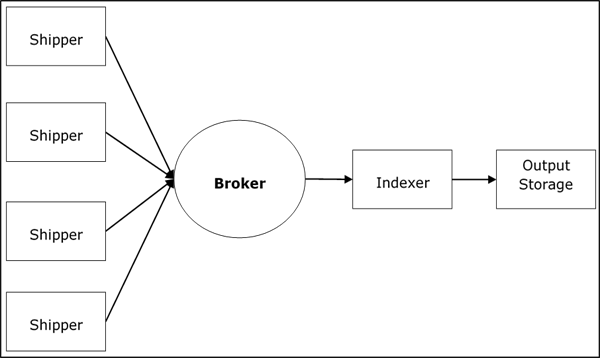
Logstash Service Architecture
Logstash processes logs from different servers and data sources and it behaves as the shipper. The shippers are used to collect the logs and these are installed in every input source. Brokers like Redis, Kafka or RabbitMQ are buffers to hold the data for indexers, there may be more than one brokers as failed over instances.
Indexers like Lucene are used to index the logs for better search performance and then the output is stored in Elasticsearch or other output destination. The data in output storage is available for Kibana and other visualization software.
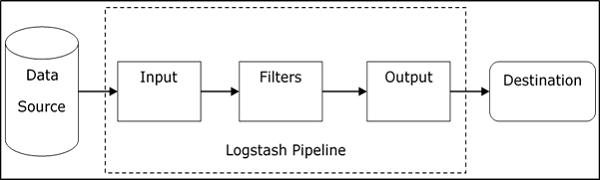
Logstash Internal Architecture
The Logstash pipeline consists of three components Input, Filters and Output. The input part is responsible to specify and access the input data source such as the log folder of the Apache Tomcat Server.
Example to Explain the Logstash Pipeline
The Logstash configuration file contains the details about the three components of Logstash. In this case, we are creating a file name called Logstash.conf.
The following configuration captures data from an input log inlog.log and writes it to an output log outlog.log without any filters.
Logstash.conf
The Logstash configuration file just copies the data from the inlog.log file using the input plugin and flushes the log data to outlog.log file using the output plugin.
input {
   file {
      path => "C:/tpwork/logstash/bin/log/inlog.log"
   }
}
output {
   file {
      path => "C:/tpwork/logstash/bin/log/outlog.log"
   }
}
Run Logstash
Logstash uses f option to specify the config file.
C:\logstash\bin> logstash f logstash.conf
inlog.log
The following code block shows the input log data.
Hello tutorialspoint.com
outlog.log
The Logstash output contains the input data in message field. Logstash also adds other fields to the output like Timestamp, Path of the Input Source, Version, Host and Tags.
{
   "path":"C:/tpwork/logstash/bin/log/inlog1.log",
   "@timestamp":"2016-12-13T02:28:38.763Z",
   "@version":"1", "host":"Dell-PC",
   "message":" Hello tutorialspoint.com", "tags":[]
}
As you can, the output of Logstash contains more than the data supplied through the input log. The output contains the Source Path, Timestamp, Version, Hostname and Tag, which are used to represent the extra messages like errors.
We can use filters to process the data and make its useful for our needs. In the next example, we are using filter to get the data, which restricts the output to only data with a verb like GET or POST followed by a Unique Resource Identifier.
Logstash.conf
In this Logstash configuration, we add a filter named grok to filter out the input data. The input log event, which matches the pattern sequence input log, only get to the output destination with error. Logstash adds a tag named "_grokparsefailure" in the output events, which does not match the grok filter pattern sequence.
Logstash offers many inbuilt regex patterns for parsing popular server logs like Apache. The pattern used here expects a verb like get, post, etc., followed by a uniform resource identifier.
input {
   file {
      path => "C:/tpwork/logstash/bin/log/inlog2.log"
   }
}
filter {
   grok {
      match => {"message" => "%{WORD:verb} %{URIPATHPARAM:uri}"}
   }
}
output {
   file {
      path => "C:/tpwork/logstash/bin/log/outlog2.log"
   }
}
Run Logstash
We can run Logstash by using the following command.
C:\logstash\bin> logstash f Logstash.conf
inlog2.log
Our input file contains two events separated by default delimiter, i.e., new line delimiter. The first event matches the pattern specified in GROk and the second one does not.
GET /tutorialspoint/Logstash
Input 1234
outlog2.log
We can see that the second output event contains "_grokparsefailure" tag, because it does not match the grok filter pattern. The user can also remove these unmatched events in output by using the if condition in the output plugin.
{
   "path":"C:/tpwork/logstash/bin/log/inlog2.log",
   "@timestamp":"2016-12-13T02:47:10.352Z","@version":"1","host":"Dell-PC","verb":"GET",
   "message":"GET /tutorialspoint/logstash", "uri":"/tutorialspoint/logstash", "tags":[]
}
{
   "path":"C:/tpwork/logstash/bin/log/inlog2.log",
   "@timestamp":"2016-12-13T02:48:12.418Z", "@version":"1", "host":"Dell-PC",
   "message":"t 1234\r", "tags":["_grokparsefailure"]
}
