- Logstash - Home
- Logstash - Introduction
- Logstash - ELK Stack
- Logstash - Installation
- Logstash - Internal Architecture
- Logstash Parse and Transform
- Logstash - Parsing the Logs
- Logstash - Filters
- Logstash - Transforming the Logs
- Logstash Output Stage
- Logstash - Output Stage
- Logstash - Supported Outputs
- Logstash Advanced Topics
- Logstash - Plugins
- Logstash - Monitoring APIs
- Logstash - Security and Monitoring
- Logstash Useful Resources
- Logstash - Quick Guide
- Logstash - Useful Resources
- Logstash - Discussion
Logstash - ELK Stack
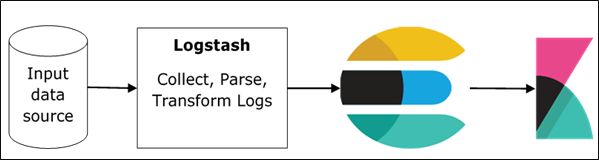
ELK stands for Elasticsearch, Logstash, and Kibana. In the ELK stack, Logstash extracts the logging data or other events from different input sources. It processes the events and later stores it in Elasticsearch. Kibana is a web interface, which accesses the logging data form Elasticsearch and visualizes it.
Logstash and Elasticsearch
Logstash provides input and output Elasticsearch plugin to read and write log events to Elasticsearch. Elasticsearch as an output destination is also recommended by Elasticsearch Company because of its compatibility with Kibana. Logstash sends the data to Elasticsearch over the http protocol.
Elasticsearch provides bulk upload facility, which helps to upload the data from different sources or Logstash instances to a centralized Elasticsearch engine. ELK has the following advantages over other DevOps Solutions −
ELK stack is easier to manage and can be scaled for handling petabytes of events.
ELK stack architecture is very flexible and it provides integration with Hadoop. Hadoop is mainly used for archive purposes. Logstash can be directly connected to Hadoop by using flume and Elasticsearch provides a connector named es-hadoop to connect with Hadoop.
ELK ownership total cost is much lesser than its alternatives.
Logstash and Kibana
Kibana does not interact with Logstash directly but through a data source, which is Elasticsearch in the ELK stack. Logstash collects the data from every source and Elasticsearch analyzes it at a very fast speed, then Kibana provides the actionable insights on that data.
Kibana is a web based visualization tool, which helps developers and others to analyze the variations in large amounts of events collected by Logstash in Elasticsearch engine. This visualization makes it easy to predict or to see the changes in trends of errors or other significant events of the input source.
