
Article Categories
- All Categories
-
 Data Structure
-
 Networking
-
 RDBMS
RDBMS
-
 Operating System
-
 Java
Java
-
 MS Excel
-
 iOS
iOS
-
 HTML
HTML
-
 CSS
CSS
-
 Android
-
 Python
-
 C Programming
-
 C++
C++
-
 C#
C#
-
 MongoDB
-
 MySQL
MySQL
-
 Javascript
-
 PHP
PHP
-
 Economics & Finance
Life Cycle Phases of Data Analytics
Life Cycle Phases of Data Analytics
The Data Analytics Lifecycle is a cyclic process which explains, in six stages, how information in made, collected, processed, implemented, and analyzed for different objectives.
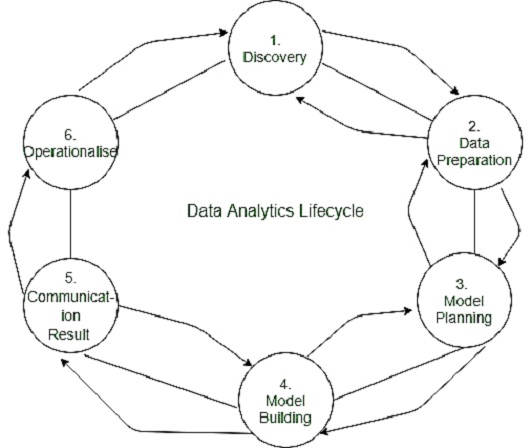
Data Discovery
This is the initial phase to set your project's objectives and find ways to achieve a complete data analytics lifecycle. Start with defining your business domain and ensure you have enough resources (time, technology, data, and people) to achieve your goals.
The biggest challenge in this phase is to accumulate enough information. You need to draft an analytic plan, which requires some serious leg work.
Accumulate resources
First, you have to analyze the models you have intended to develop. Then determine how much domain knowledge you need to acquire for fulfilling those models.
The next important thing to do is assess whether you have enough skills and resources to bring your projects to fruition.
Frame the issue
Problems are most likely to occur while meeting your client's expectations. Therefore, you need to identify the issues related to the project and explain them to your clients. This process is called "framing." You have to prepare a problem statement explaining the current situation and challenges that can occur in the future. You also need to define the project's objective, including the success and failure criteria for the project.
Formulate initial hypothesis
Once you gather all the clients' requirements, you have to develop initial hypotheses after exploring the initial data.
Data Preparation and Processing
The Data preparation and processing phase involves collecting, processing, and conditioning data before moving to the model building process.
Identify data sources
You have to identify various data sources and analyze how much and what kind of data you can accumulate within a given timeframe. Evaluate the data structures, explore their attributes and acquire all the tools needed.
Collection of data
You can collect data using three methods:
Data acquisition: You can collect data through external sources.
Data Entry: You can prepare data points through digital systems or manual entry as well.
Signal reception: You can accumulate data from digital devices such as IoT devices and control systems.
Model Planning
This is a phase where you have to analyze the quality of data and find a suitable model for your project.
Loading Data in Analytics Sandbox
An analytics sandbox is a part of data lake architecture that allows you to store and process large amounts of data. It can efficiently process a large range of data such as big data, transactional data, social media data, web data, and many more. It is an environment that allows your analysts to schedule and process data assets using the data tools of their choice. The best part of the analytics sandbox is its agility. It empowers analysts to process data in real-time and get essential information within a short duration.
Data are loaded in the sandbox in three ways:
ETL − Team specialists make the data comply with the business rules before loading it in the sandbox.
ELT − The data is loaded in the sandbox and then transform as per business rules.
ETLT − It comprises two levels of data transformation, including ETL and ELT both.
The data you have collected may contain unnecessary features or null values. It may come in a form too complex to anticipate. This is where data exploration' can help you uncover the hidden trends in data.
Steps involved in data exploration:
- Data identification
- Univariate Analysis
- Multivariate Analysis
- Filling Null values
- Feature engineering
For model planning, data analysts often use regression techniques, decision trees, neural networks, etc. Tools mostly used for model planning and execution include Rand PL/R, WEKA, Octave, Statista, and MATLAB.
Model Building
Model building is the process where you have to deploy the planned model in a real-time environment. It allows analysts to solidify their decision-making process by gain in-depth analytical information. This is a repetitive process, as you have to add new features as required by your customers constantly.
Your aim here is to forecast business decisions and customize market strategies and develop tailor-made customer interests. This can be done by integrating the model into your existing production domain.
In some cases, a specific model perfectly aligns with the business objectives/ data, and sometimes it requires more than one try. As you start exploring the data, you need to run particular algorithms and compare the outputs with your objectives. In some cases, you may even have to run different variances of models simultaneously until you receive the desired results.
Result Communication and Publication
This is the phase where you have to communicate the data analysis with your clients. It requires several intricate processes where you how to present information to clients in a lucid manner. Your clients don't have enough time to determine which data is essential. Therefore, you must do an impeccable job to grab the attention of your clients.
Check the data accuracy
Is the data provide information as expected? If not, then you have to run some other processes to resolve this issue. You need to ensure the data you process provides consistent information. This will help you build a convincing argument while summarizing your findings.
Highlight important findings
Well, each data holds a significant role in building an efficient project. However, some data inherits more potent information that can truly serve your audience's benefits. While summarizing your findings, try to categorize data into different key points.
Determine the most appropriate communication format
How you communicate your findings tells a lot about you as a professional. We recommend you to go for visuals presentation and animations as it helps you to convey information much faster. However, sometimes you also need to go old-school as well. For instance, your clients may have to carry the findings in physical format. They may also have to pick up certain information and share them with others.
Operationalize
As soon you prepare a detailed report including your key findings, documents, and briefings, your data analytics life cycle almost comes close to the end. The next step remains the measure the effectiveness of your analysis before submitting the final reports to your stakeholders.
In this process, you have to move the sandbox data and run it in a live environment. Then you have to closely monitor the results, ensuring they match with your expected goals. If the findings fit perfectly with your objective, then you can finalize the report. Otherwise, you have to take a step back in your data analytics lifecycle and make some changes.

6K+ Views
