
Article Categories
- All Categories
-
 Data Structure
-
 Networking
-
 RDBMS
RDBMS
-
 Operating System
-
 Java
Java
-
 MS Excel
-
 iOS
iOS
-
 HTML
HTML
-
 CSS
CSS
-
 Android
-
 Python
-
 C Programming
-
 C++
C++
-
 C#
C#
-
 MongoDB
-
 MySQL
MySQL
-
 Javascript
-
 PHP
PHP
-
 Economics & Finance
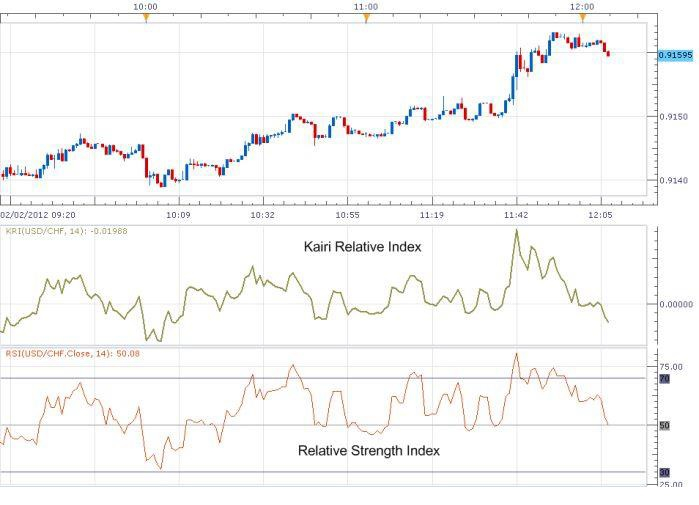
Kairi relative index
Traders use the Kairi Relative Index to determine whether it is appropriate to purchase or sell a certain asset. It analyzes the price's divergence from the simple moving average (SMA) of that asset's price over a given period of time, which is commonly 10 to 20 days.
If the price of an asset is much higher than the asset's simple moving average over a specified time period, the Kairi Relative Index encourages selling. Whenever the price of a security is much lower than the simple moving average, the index supports purchasing the security.
Kairi Relative Index in a Glance
The Kairi Relative Index (KRI) is a momentum oscillator indicator that aids in technical analysis by tracking the rate of change in the price of an asset. A momentum oscillator is a tool that monitors the change in the price of an asset over a certain period of time. A common way to compute it is to divide the current price by the price of the prior period. Following the formula, the computation of different oscillator indicators differs in order to better suit the needs of different users and applications.
Most of the time, the result is multiplied by 100, which results in a threshold value of 100. A score less than 100 indicates a negative momentum with a dropping price, while a number more than 100 shows a positive momentum with a growing price throughout the selected time period.
How to use the KRI Formula?
The KRI is one of several different types of momentum oscillators available. It assesses the current price against the moving average of the price over the current selected time, which is calculated as follows −
$$Momentum\:Oscillator=\frac{Current\:Price}{Price\:n\:Periods\:ago}\times\:100$$
$$KRI=\frac{(Price-MVA)}{MVA}\times\:100$$
Example
Let us look at stocks and calculate the KRI
The KRI will be -18 [($45–$55) / $55*100] if the price of a security is presently $50 and its current 10-day moving average (MVA) is $55. Let us consider, the price of a stock is now $45 and the current 10-day MVA is $50. Suppose the price rises to $80 two weeks later, and the 10-day MVA similarly rises to $65, resulting in a KRI of 23.07[($80–$65) / $65*100] and a 10-day MVA of $65.
Assume that a value of 23.07 represents the asset's highest point in terms of its KRI. It indicates that the asset may be overbought, and that a movement of mean reversal is likely to occur shortly.
How to use the Kairi Relative Index?
The KRI, as a technical analysis tool, aids traders in making buy and sell choices by providing them with more information. The KRI is depicted as a line that moves up and down around the zero point. An upward sloping KRI line suggests that the price is moving higher, whilst a downward sloping KRI line suggests that the price is moving downward. When the line is a long distance away from zero, the momentum is considerable.
When the KRI is much higher than zero, it indicates that the asset is likely overbought (overvalued). Trading professionals who are anticipating a mean reversal or corrective downturn might take advantage of this indication. A KRI that is much lower than zero indicates that the market is oversold (undervalued), and traders often act on this knowledge to make purchase choices.

478 Views
