- JDB - Home
- JDB - Introduction
- JDB - Installation
- JDB - Syntax
- JDB - Options
- JDB - Session
- JDB - Basic Commands
- JDB - Breakpoints
- JDB - Stepping
- JDB - Exception
- JDB - In Eclipse
JDB - Quick Guide
JDB - Introduction
Debugging is a technical procedure to find and remove bugs or defects in a program and get expected results. Debugging includes testing and monitoring. It is very complex when the subunits of a program are tightly coupled. We can debug a program using the debugger tools that follow the prescribed APIs. A debugger allows you to step through every aspect of a code, inspect all the elements, and remove errors, if any.
Debugging Techniques
There are different kinds of techniques to debug a Java program. The old method of debugging is by using print statements at the end of every segment which will print the trace statements on the console. Take a look at the following code.
pubic class Add
{
   public static void main(String ar[])
   {
      int a=ar[0];
      system.out.println("A : " +a);
      int b=ar[1];
      system.out.println("B : " +b);
      int c = a + b;
      system.out.println("C = a + b : " +c);
   }
}
Here, we have a program that adds two numbers and prints the output. Notice that at each step, we have introduced a print statement that prints the state of the program on the console. This is the traditional approach to debug a program.
In addition, we have advanced concepts that can be used to debug a program such as:
- stepping
- breakpoints, and
- exceptions or watchpoints.
Types of Debugging
We can debug a program using various methods:
- Using Java bytecode (compiled version of Java code)
- Using comments inside the programs
- Attaching class to a running program
- Remote debugging
- Debugging on demand
- Optimized code debugging
Java Debuggers
Here are some examples of Java debuggers that are available in the market:
- IDEs such as Eclipse, Netbeans, etc. contain their own debuggers (Visual cafe, Borland, JBuilder)
- Standalone debugger GUIs (such as Jikes, Java platform debugger, and JProbe)
- Command-line debugger (Suns JDB)
- Notepad or VI driven (stack trace)
This tutorial covers how to use the command-line debugger, jdb.
JDB
The Java debugger (JDB) is a tool for Java classes to debug a program in command line. It implements the Java Platform Debugger Architecture. It helps in detecting and fixing bugs in a Java program using Java Debug Interface (JDI).
JDB in JDK
The following architecture defines the role of JDB in JDK. It contains mainly three units:
- Java Virtual Machine Tool Interface (JVM TI)
- Java Debug Wiring Pool (JDWP)
- Java Debugger Interface (JDI)
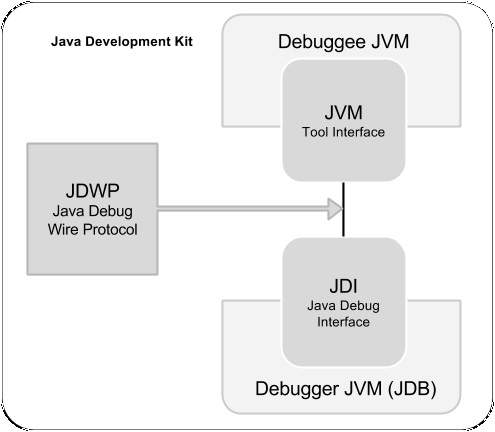
JVM TI
It is a native programming interface implemented by VM. It provides ways to inspect and debug the state of the application running on the VM. It allows an implementer (VM Implementer) that can be enclosed easily into the debugging architecture. It also uses a third-party channel called JDWP for communication.
JDWP
It defines the format of information and the requests that pass in between the debuggee process and the debugger front end. The primary purpose of having a JDWP is to allow the debuggee and the debugger to communicate when they run under separate VMs or in separate platforms.
JDI
It is a high-level Java interface implemented as front end. It defines the variable information at user code level. It is recommended to use a JDI layer for all debugger development. It uses JDWP for communication with the debuggee JVM.
JDB - Installation
This chapter explains how to install JDB on Windows and Linux based systems. JDB is a part of JDK. Therefore, JDK installation is enough for using JDB in command prompt.
System Requirements
Here are the system requirements for installing JDB:
| JDK | Java SE 2 JDK 1.5 or above |
| Memory | 1 GB RAM (recommended) |
| Disk Space | No minimum requirement |
| Operating System Version | Windows XP or above, Linux |
Follow the simple steps given below to install JDB on your system.
Step 1: Verifying Java Installation
First of all, you need to have Java Software Development Kit (SDK) installed on your system. To verify this, execute any of the two commands depending on the platform you are working on.
If the Java installation has been done properly, then it displays the current version and specifications of Java installation. A sample output is given in the following table.
| Platform | Command | Sample Output |
|---|---|---|
| Windows |
Open command console and type: \>java version |
Java version "1.7.0_60" Java (TM) SE Run Time Environment (build 1.7.0_60-b19) Java Hotspot (TM) 64-bit Server VM (build 24.60-b09,mixed mode) |
| Linux |
Open command terminal and type: $java version |
java version "1.7.0_25" Open JDK Runtime Environment (rhel-2.3.10.4.el6_4-x86_64) Open JDK 64-Bit Server VM (build 23.7-b01, mixed mode) |
We assume the readers of this tutorial have Java SDK version 1.7.0_60 installed on their system. In case you do not have Java SDK, download its current version from the link http://www.oracle.com/technetwork/java/javase/downloads/index.html and install it.
Step 2: Setting Up Java Environment
Set the environment variable JAVA_HOME to point to the base directory location where Java is installed on your machine. For example,
| Platform | Description |
|---|---|
| Windows | set JAVA_HOME to C:\ProgramFiles\java\jdk1.7.0_60 |
| Linux | export JAVA_HOME=/usr/local/java |
Append the full path of Java compiler location to the System Path.
| Platform | Description |
|---|---|
| Windows | Append the String "C:\Program Files\Java\jdk1.7.0_60\bin" at the end of the system variable PATH. |
| Linux | export PATH=$PATH:$JAVA_HOME/bin/ |
Execute the command java -version from the command prompt as explained above.
Step 3: Verifying JDB Installation
Verify the JDB version as follows:
| Platform | Command | Sample Output |
|---|---|---|
| Windows |
Open command console and type: \>jdb version |
This is JDB version 1.6 (Java SE version 1.7.0_60) |
| Linux |
Open command terminal and type: $jdb version |
This is JDB version 1.6 (Java SE version 1.7.0_60) |
JDB - Syntax
This chapter explains the syntax of JDB command. The syntax contains four sections listed as follows:
- JDB
- option
- class
- arguments
Syntax
The syntax of JDB is as follows.
jdb [ options ] [ class ] [ arguments ]
JDB
It calls jdb.exe from the Java Development Kit.
Options
These include the command line options used to debug a Java program in an efficient way. The JDB launcher accepts all the options (such as -D, -classpath, and -X) and some additional advanced options such as (-attach, -listen, -launch, etc.).
Class
It is the class name on which you want to perform debugging operations.
Arguments
These are the input values given to a program at runtime. For example, arg[0], arg[1] to the main() method.
In the above four segments, options is the most important one.
JDB - Options
This chapter describes the important options available in JDB that are submitted as arguments with the jdb command.
Options
The following table contains a list of options accepted by JDB:
| Name | Description |
|---|---|
| -help | Displays the help message and lists the related options. |
| -sourcepath | Uses the given path for source files if path is not specified, then it takes the default path ., i.e., the current directory. |
| -attach | Attaches the debugger to the running VM by specifying the running VM address. |
| -listen | Waits for the running VM to connect using standard connector. |
| -listenany | Waits for the running VM to connect using any address. |
| -launch | Launches the debugged application immediately up on startup job. |
| -listconnectors | Lists the connectors available in this VM. |
| -connect | Connects to the target VM using named connector with listed argument values. |
| -dbgtrace | Prints information for debugging jdb. |
| -tclient | Runs the application in Java Hotspot VM (client). |
| -tserver | Runs the application in Java Hotspot VM (server). |
| -Joption | Passes the option to the Java virtual machine used to run JDB. |
Using Options with Commands
The following commands show how to use some of the above options:
-help
The following command gets -help on using JDB.
\>jdb -help
-attach
The following command attaches the debugger to a specified VM (port number:1099).
\> jdb -attach 1099
-listen
The following command makes the JDB process running on the current VM wait using standard connector (VM in 8008).
\>jdb -listen 8088
-listenany
The following command makes the JDB process running on the current VM wait using any connector (VM in currently running port).
\>jdb listenany
-tclient
The following command executes the application in Java Hotspot() VM(client).
\>jdb tclient
-tserver
The following command executes the application in Java Hotspot() VM(server).
\>jdb -tserver
JDB - Session
This chapter describes how to start a JDB session in different ways. JDB launch is the frequently used technique to start a JDB session.
There are two different ways to start a JDB session:
- Starting JDB session by adding class (main class name) to it.
- Adding JDB to running JVM to start session.
Start a Session by Adding Class
The following command starts a JDB session:
Syntax
\>jdb <classname>
Example
Let us assume we have a class named TestClass. The following command starts a JDB session from the TestClass.
\>jdb TestClass
If you follow this command, it starts a new Java VM with any specified parameters. Thereafter it loads the class and stops it before executing the first statement of the class.
Start a Session by Adding JDB to a Running JVM
Given below is the syntax and example to start a JDB session by adding the JDB to a running JVM.
Syntax
The following syntax is for JDB session:
-agentlib:jdwp=transport=dt_shmem,address=,server=y,suspend=n
Example
Let us assume the main class name is TestClass and JVM allows the JDB to connect it later. The following is the command to add JDB to JVM:
\>java
-agentlib:jdwp=transport=dt_shmem,address=jdbconn,server=y,suspend=n TestClass
Now you can attach the JDB to the JVM with the following command:
\> jdb -attach jdbconn
Note: Here, the TestClass is not added to the JDB command, because JDB is connected to the running VM instead of launching a new one.
JDB - Basic Commands
This chapter takes you through the basic commands of JDB. After launching a session, these commands are used for debugging a program.
The following is the list of commands used for debugging.
| Name | Description |
|---|---|
| help or ? | The most important JDB command; it displays a list of recognized commands with a brief description. |
| run | After starting JDB and setting the necessary breakpoints, you can use this command to start execution and debug an application. |
| cont | Continues execution of the debugged application after a breakpoint, exception, or step. |
| Displays Java objects and primitive values. | |
| dump | For primitive values, this command is identical to print. For objects, it prints the current value of each field defined in the object. Static and instance fields are included. |
| threads | Lists the threads that are currently running. |
| thread | Selects a thread to be the current thread. |
| where | Dumps the stack of the current thread. |
Example
Let us assume we have a sample class called Add for the following examples:
Add.java
public class Add
{
   public int addition( int x, int y)
   {
      int z = x+y;
      return z;
   }
   public static void main( String ar[ ] )
   {
      int a = 5, b = 6;
      Add ob = new Add();
      int c = ob.addition(a,b);
      System.out.println("Add: "+c);
   }
}
Compile this class Add.java using the following command:
\>javac Add.java
Run
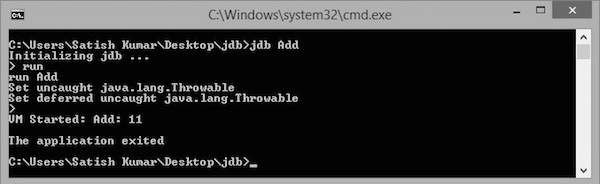
This command executes the main class file, which is added to JDB for debugging. Execute the following commands to run the Add class.
\>jdb Add
initializing jdb
>run
On executing these commands, you get to see the following output:
JDB - Breakpoints
This chapter explains the concept of breakpoints and how to set breakpoints in a program. A breakpoint introduces an explicit stop or pause in the execution of a program at a particular line of code while debugging. It is useful to acquire knowledge about variables in the program in its execution.
Syntax
The following command sets up a breakpoint at a particular line number:
> stop at <class name>:<Line no>
The following command sets up a breakpoint on a particular method or on a particular variable:
> stop in <class name>:< Method name | Variable name>
Example
The following example shows how to set up a breakpoint in a class.
public class Add
{
   public int addition( int x, int y)
   {
      int z = x+y;
      return z;
   }
   public static void main( String ar[ ] )
   {
      int a = 5, b = 6;
      Add ob = new Add();
      int c = ob.addition(a,b);
      System.out.println("Add: "+c);
   }
}
Save the above file as Add.java. Compile this file using the following command:
\>javac Add.java
Debugging
Let us take an example for debugging. Here, we start the debugging process by setting up a breakpoint on main(). Given below are the steps to be followed in the debugging process:
Step 1: Start a JDB Session
The following command starts a JDB session on the Add class for debugging:
\> jdb Add
Step 2: Set a Breakpoint
The following command sets up a breakpoint on the main() method of Add class.
> stop in Add.main
If the breakpoint is set successfully, you get to see the following output:
Deferring breakpoint Add.main.
It will set after the class is loaded.
>
Step 3: Start Debugging
The following command starts execution of the class Add:
> run Add
If you run this command, you get to see the following output. In this output, you find that the execution stops at the breakpoint position, that is at the main() function.
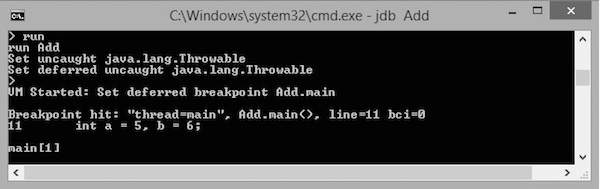
The execution stops at the first line of the main method, that is at "int a=5, b=6;" or Line no: 11 in the code. You can observe this information in the output.
Step 4: Continue Execution
The following command continues the program execution:
cont
It gives you the remaining execution part and output as follows:
> Add:11
The application exited
\>
JDB - Stepping
This chapter explains how to use the concept of Stepping in debugging a program. Stepping is the debugger feature that lets you execute the code by stepping through line by line. Using this, you can examine each line of the code to ensure they are behaving as intended.
The following commands are used in the stepping process:
- step: steps to the next line of execution
- list: examines where you are in the code
- cont: continues the remaining execution
Example
The following example uses the Add class that we have used in the previous chapter:
public class Add
{
   public int addition( int x, int y)
   {
      int z = x+y;
      return z;
   }
   public static void main( String ar[ ] )
   {
      int a = 5, b = 6;
      Add ob = new Add();
      int c = ob.addition(a,b);
      System.out.println("Add: "+c);
   }
}
Save the above file as Add.java. Compile this file using the following command:
\>javac Add.java
Let us assume that the breakpoint is set on the main() method of the Add class. The following steps show how to apply stepping in the Add class.
Step 1: Execute the Job
The following command starts executing the class named Add.
> run Add
If you execute this command, you get to see the following output. In this output, you can find that the execution stops at the breakpoint position, i.e., at the main() method.

The execution stops at the first line of the main method, that is at "int a=5, b=6;" or Line no: 11 in the code. You can observe this information in the output.
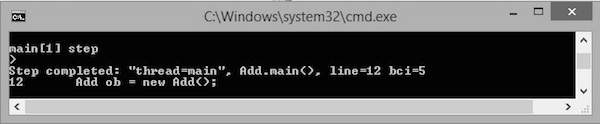
Step 2: Step through the Code
The following command steps the execution to the next line.
main[1] step
Now the execution steps to Line no: 12. You get to see the following output.
Step 3: List the Code
The following command lists the code:
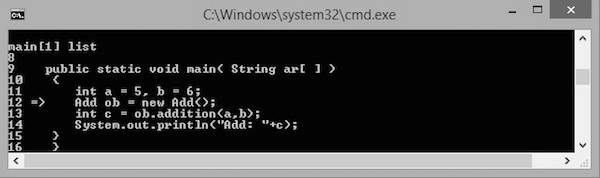
main[1] list
You get the following output. List command is used to let you know the line in the code up to which the program control has reached. Notice the arrow mark => in the following screenshot that shows the current position of the program control.
Step 4: Continue Execution
The following command continues to execute the code:
main[1] cont
This command continues executing the remaining lines of the code. The output is as shown below:
> Add:11
The application exited
\>
Generally, there are three types of stepping:
- Step Into
- Step Over
- Step Out
Step Into
Using this command, you can step to the next line of the code. If the next line of the code is a function call, then it enters the function by driving the control at the top line of the function.
In the following code, the arrow mark defines the controller in the code.
public class Add
{
   public int addition( int x, int y)
   {
      int z = x+y;
      return z;
   }
   public static void main( String ar[ ] )
   {
      int a = 5, b = 6;
      -> Add ob = new Add();
      int c = ob.addition(a,b);
      System.out.println("Add: "+c);
   }
}
If you use the step into command, the controller moves to the next line, i.e., "int c = ob.addition(a,b);". At this line, there is a function call addition(int, int) hence the controller moves to the topmost line of the addition function with the arrow mark as shown below:
public class Add
{
   public int addition( int x, int y)
   -> {
      int z = x+y;
      return z;
   }
   public static void main( String ar[ ] )
   {
      int a = 5, b = 6;
      Add ob = new Add();
      int c = ob.addition(a,b);
   System.out.println("Add: "+c);
   }
}
Step Over
Step Over also executes the next line. But if the next line is a function call, it executes that function in the background and returns the result.
Let us take an example. In the following code, the arrow mark defines the control in the code.
public class Add
{
   public int addition( int x, int y)
   {
      int z = x+y;
      return z;
   }
   public static void main( String ar[ ] )
   {
      int a = 5, b = 6;
      -> Add ob = new Add();
      int c = ob.addition(a,b);
      System.out.println("Add: "+c);
   }
}
If you use the step over command, the control moves to the next line, i.e., "int c = ob.addition(a,b);". In this line, there is a function call addition(int, int) hence the function execution is done in the background and the result is returned to the current line with the arrow mark as shown below:
public class Add
{
   public int addition( int x, int y)
   {
      int z = x+y;
      return z;
   }
   public static void main( String ar[ ] )
   {
      int a = 5, b = 6;
      Add ob = new Add();
      -> int c = ob.addition(a,b);
      System.out.println("Add: "+c);
   }
}
Step Out
Step Out executes the next line. If the next line is a function call, it skips that and the function execution continues with the remaining lines of the code.
Let us take an example. In the following code, the arrow mark defines the controller in the code.
public class Add
{
   public int addition( int x, int y)
   {
      int z = x+y;
      return z;
   }
   public static void main( String ar[ ] )
   {
      int a = 5, b = 6;
      -> Add ob = new Add();
      int c = ob.addition(a,b);
      System.out.println("Add: "+c);
   }
}
If you use the step out command, the controller moves to the next line, i.e., "int c = ob.addition(a,b);". In this line, there is a function call addition(int, int) hence the function execution is skipped and the remaining execution continues with the arrow mark as shown below:
public class Add
{
   public int addition( int x, int y)
   {
      int z = x+y;
      return z;
   }
   public static void main( String ar[ ] )
   {
      int a = 5, b = 6;
      Add ob = new Add();
      -> int c = ob.addition(a,b);
      System.out.println("Add: "+c);
   }
}
JDB - Exception
This chapter explains how to handle the exception class using JDB. Generally, whenever a program raises an exception without a catch statement, then the VM prints the exception line, the cause of the exception, and exits. If the exception has been raised with a catch statement, then the exception is handled by the catch statement. Here, the VM prints the output with the cause of exception.
When the class that raises the exception is running under JDB, it also throws the uncaught exception. That exception can be handled using the catch command.
Example
Let us take an example of the class JdbException:
public class JdbException
{
   public static void main(String ar[]) throws Exception
   {
      int a=8, b=0;
      System.out.println("Welcome");
      System.out.println("Ex: "+(a/b));
   }
}
Save the above file with the name JdbException.java. Compile this file using the following command:
\>javac JdbException.java
Follow the steps given below to handle the exception.
Step 1: Run the Class
The following command executes the class named JdbException as follows:
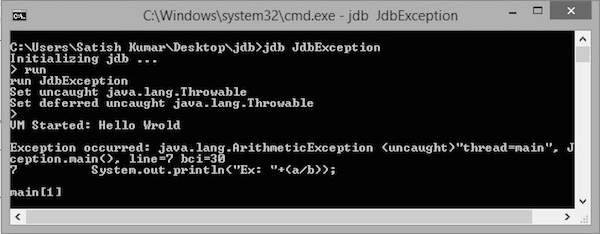
\>jdb JdbException
>run
This JdbException class contains an exception, hence you get to see the following output:
Step 2: Catch the Exception
The following command catches the exception:
mian[1] catch java.lang.ArithmeticException
It will give you the following output:
Set all java.lang.ArithmeticException
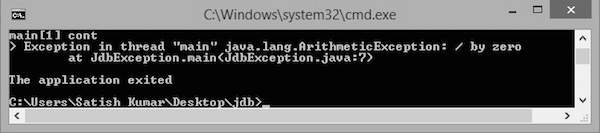
Step 3: Continue Execution
The following command continues the execution. Now the catch handles the arithmetic exception as follows:
JDB - In Eclipse
This chapter explains how to use JDB in Eclipse. Before proceeding further, you need to install Eclipse Indigo. Follow the steps given below to install Eclipse Indigo on your system.
Step 1: Download and Install Eclipse
You can download Eclipse from the following link: http://www.eclipse.org/downloads/packages/eclipse-ide-java-ee-developers/indigosr2
Step 2: Create a New Project and a New Class
- Create a new Java project by following the options File-> New -> Java project.
- Name it as sampledebug.
- Create a new class by right clicking on the samplebebug project.
- Select options ->new -> class
- Name it as Add.java
Add.java
public class Add
{
   public int addition( int x, int y)
   {
      int z = x+y;
      return z;
   }
   public static void main( String ar[ ] )
   {
      int a = 5, b = 6;
      Add ob = new Add();
      int c = ob.addition(a,b);
      System.out.println("Add: "+c);
   }
}
Step 3: Open the Debug Perspective
Follow the instructions given below to open the debug perspective.
On the Eclipse IDE, go to Window -> Open perspective -> Debug. Now you get the debug perspective for the program Add.java. You get to see the following window.
Sections in Debug Perspective
The sections in the Debug perspective are as follows:
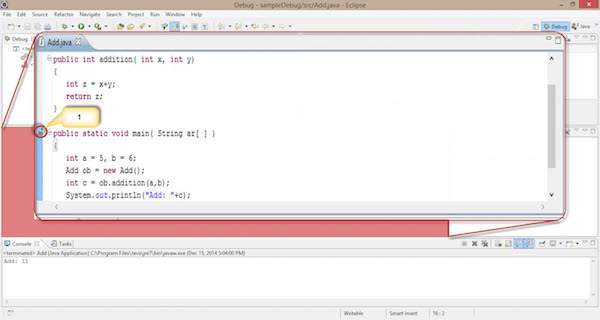
Coding Section
Java code is displayed in this section. It is the code you want to debug, that is, Add.java. Here we can add a breakpoint on a line by double clicking in front of the line. You find the blue bubble with an arrow symbol to point out the breakpoint of that line. See the following screenshot; you can find the selected area with a red circle pointed as 1.
- Double click here. You can set the breakpoint for this line.
Breakpoint Section
This section defines the list of breakpoints that are set to the program code. Here we can add, delete, find, and manage the breakpoints. The following screenshot shows the breakpoint section.
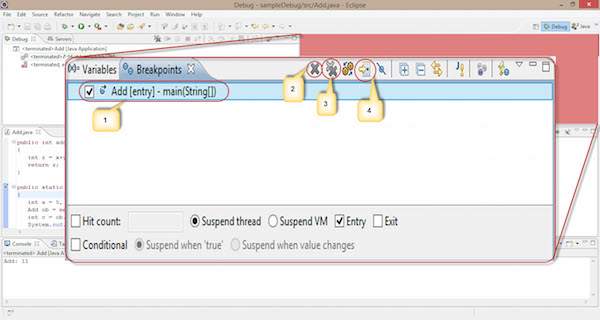
Observe the following options in the given screenshot:
Using the check box in the left, we can select or deselect a breakpoint. Here, we use one breakpoint, i.e., Add class-main() method.
The single cross icon X is used to delete the selected breakpoint.
The double cross icon XX is used to delete all the breakpoints in your code.
The arrow pointer is used to point to the code where the selected breakpoint is applied.
The remaining functionalities in the breakpoint section are as follows:
Hitcount : It shows how many times the control hits this breakpoint. It is used for recursive logic.
Suspend thread : We can suspend the current thread by selecting it.
Suspend VM : We can suspend the VM by selecting it.
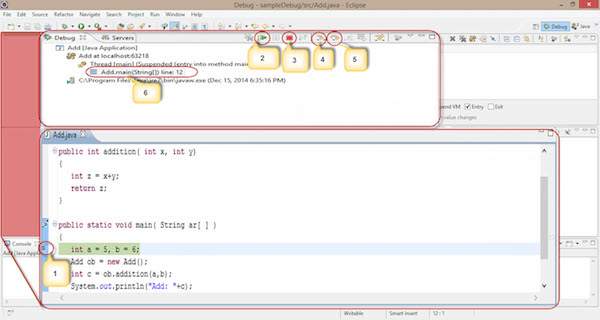
Debug Section
This section is used for the process of debugging. It contains options that are used in debugging.
Start debugging : Follow the instructions given below to start debugging.
Right click on the code -> click Debug as -> click 1 Java application.
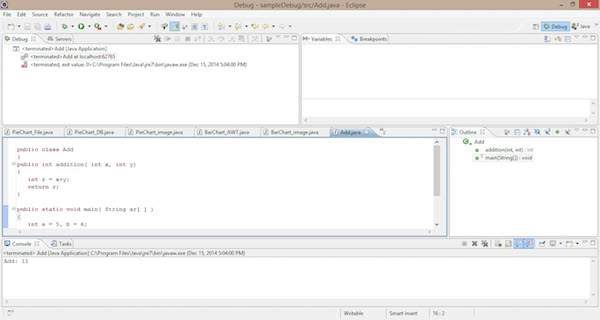
The process of debugging starts as shown in the following screenshot. It contains some selected options, highlighted using numeric digits.
We apply a breakpoint on the Add class main() method. When we start debugging, the controller gets stuck at the first line of the main() method.
It is used to Resume the debugging process and skip the current breakpoint. It works similar to the cont command in the JDB command line.
It is used to stop the debugging process.
It works similar to the step in process in the JDB command line. It is used for moving the control to the next line, i.e., point 1 moves to the next line.
It works similar to the step over process in the JDB command line.
It is used to see on which line the breakpoint is applied.
Follow the given steps and sections to debug your code in eclipse IDE. By default, every IDE contains this debugging process.
