- JDB - Home
- JDB - Introduction
- JDB - Installation
- JDB - Syntax
- JDB - Options
- JDB - Session
- JDB - Basic Commands
- JDB - Breakpoints
- JDB - Stepping
- JDB - Exception
- JDB - In Eclipse
JDB - In Eclipse
This chapter explains how to use JDB in Eclipse. Before proceeding further, you need to install Eclipse Indigo. Follow the steps given below to install Eclipse Indigo on your system.
Step 1: Download and Install Eclipse
You can download Eclipse from the following link: http://www.eclipse.org/downloads/packages/eclipse-ide-java-ee-developers/indigosr2
Step 2: Create a New Project and a New Class
- Create a new Java project by following the options File-> New -> Java project.
- Name it as sampledebug.
- Create a new class by right clicking on the samplebebug project.
- Select options ->new -> class
- Name it as Add.java
Add.java
public class Add
{
   public int addition( int x, int y)
   {
      int z = x + y;
      return z;
   }
   public static void main( String ar[ ] )
   {
      int a = 5, b = 6;
      Add ob = new Add();

      int c = ob.addition(a,b);
      System.out.println("Add: " + c);
   }
}
Step 3: Open the Debug Perspective
Follow the instructions given below to open the debug perspective.
On the Eclipse IDE, go to Window -> Open perspective -> Debug. Now you get the debug perspective for the program Add.java. You get to see the following window.
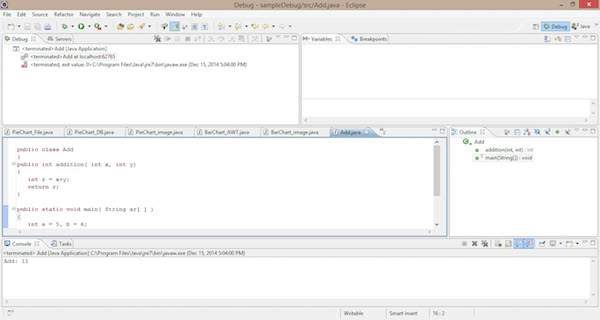
Sections in Debug Perspective
The sections in the Debug perspective are as follows:
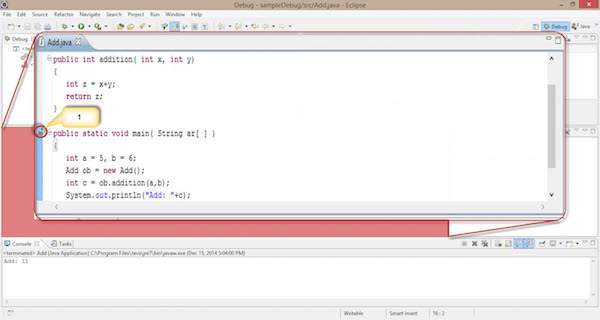
Coding Section
Java code is displayed in this section. It is the code you want to debug, that is, Add.java. Here we can add a breakpoint on a line by double clicking in front of the line. You find the blue bubble with an arrow symbol to point out the breakpoint of that line. See the following screenshot; you can find the selected area with a red circle pointed as 1.
- Double click here. You can set the breakpoint for this line.
Breakpoint Section
This section defines the list of breakpoints that are set to the program code. Here we can add, delete, find, and manage the breakpoints. The following screenshot shows the breakpoint section.
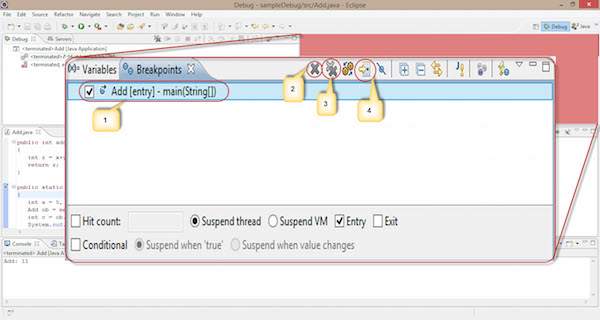
Observe the following options in the given screenshot:
Using the check box in the left, we can select or deselect a breakpoint. Here, we use one breakpoint, i.e., Add class-main() method.
The single cross icon X is used to delete the selected breakpoint.
The double cross icon XX is used to delete all the breakpoints in your code.
The arrow pointer is used to point to the code where the selected breakpoint is applied.
The remaining functionalities in the breakpoint section are as follows:
Hitcount : It shows how many times the control hits this breakpoint. It is used for recursive logic.
Suspend thread : We can suspend the current thread by selecting it.
Suspend VM : We can suspend the VM by selecting it.
Debug Section
This section is used for the process of debugging. It contains options that are used in debugging.
Start debugging : Follow the instructions given below to start debugging.
Right click on the code -> click Debug as -> click 1 Java application.
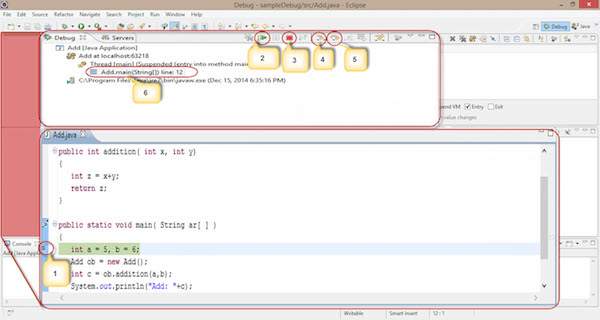
The process of debugging starts as shown in the following screenshot. It contains some selected options, highlighted using numeric digits.
We apply a breakpoint on the Add class main() method. When we start debugging, the controller gets stuck at the first line of the main() method.
It is used to Resume the debugging process and skip the current breakpoint. It works similar to the cont command in the JDB command line.
It is used to stop the debugging process.
It works similar to the step in process in the JDB command line. It is used for moving the control to the next line, i.e., point 1 moves to the next line.
It works similar to the step over process in the JDB command line.
It is used to see on which line the breakpoint is applied.
Follow the given steps and sections to debug your code in eclipse IDE. By default, every IDE contains this debugging process.
