
Article Categories
- All Categories
-
 Data Structure
-
 Networking
-
 RDBMS
RDBMS
-
 Operating System
-
 Java
Java
-
 MS Excel
-
 iOS
iOS
-
 HTML
HTML
-
 CSS
CSS
-
 Android
-
 Python
-
 C Programming
-
 C++
C++
-
 C#
C#
-
 MongoDB
-
 MySQL
MySQL
-
 Javascript
-
 PHP
PHP
-
 Economics & Finance
Selected Reading
How to suppress Matplotlib warning?
Let's take an example. We create a set of data points such that it would generate some warnings. We will create data points x from −1 to 1 and try to find log in that range, which means it will throw an error at value 0, while calculating logs.
Steps
- Create data points for x and calculate log(x), using numpy.
- Plot x and y using plot() method.
- Use warnings.filterwarnings("ignore") to suppress the warning.
- To display the figure, use show() method.
Example
import numpy as np
from matplotlib import pyplot as plt
import warnings
plt.rcParams["figure.figsize"] = [7.00, 3.50]
plt.rcParams["figure.autolayout"] = True
warnings.filterwarnings("ignore")
x = np.linspace(-1, 1, 10)
y = np.log(x)
plt.plot(x, y)
plt.show()
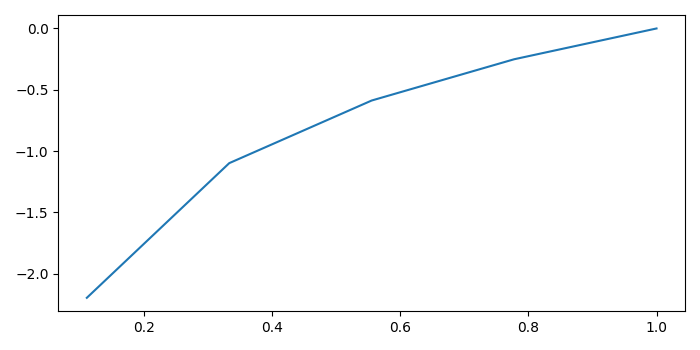
Output
When we execute the code, it will suppress the warning and display the following plot.
Now, remove the line, warnings.filterwarnings("ignore") and execute the code again. It will display the plot, but with a runtime warning.
RuntimeWarning: invalid value encountered in log

Updated on: 2021-05-07T08:01:45+05:30
5K+ Views

Advertisements