
Article Categories
- All Categories
-
 Data Structure
-
 Networking
-
 RDBMS
RDBMS
-
 Operating System
-
 Java
Java
-
 MS Excel
-
 iOS
iOS
-
 HTML
HTML
-
 CSS
CSS
-
 Android
-
 Python
-
 C Programming
-
 C++
C++
-
 C#
C#
-
 MongoDB
-
 MySQL
MySQL
-
 Javascript
-
 PHP
PHP
-
 Economics & Finance
Selected Reading
How to share x axes of two subplots after they have been created in Matplotlib?
First, we can create two axes using the subplot method where nrows=2, ncols=1. That means, we can have two indices to plot the desired plot. We can use ax1.get_shared_x_axes().join(ax1,ax2) method for our plot.
Steps
Create two lists of the numbers.
Add a subplot to the current figure, ax1, where nrows = 2, ncols = 1, and index is 1 for ax1.
Add a subplot to the current figure, ax2, where nrows = 2, ncols = 1, and index is 2 for ax2.
Plot x and y using points that are created in step 1.
Using get_shared_x_axes().join(ax1, ax2), return a reference to the shared axes Grouper object for axes.
Set X-axis tick labels of the grid, with empty list, using set_xticklabels method.
Use plt.show() to show the figure.
Example
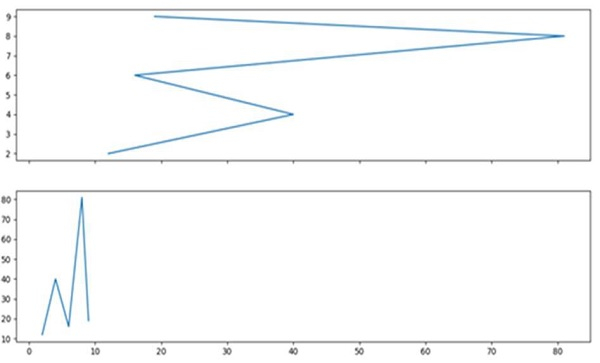
import matplotlib.pyplot as plt

x = [2, 4, 6, 8, 9]
y = [12, 40, 16, 81, 19]

ax1 = plt.subplot(211)
ax2 = plt.subplot(212)

ax1.plot(y, x)
ax2.plot(x, y)

ax1.get_shared_x_axes().join(ax1, ax2)
ax1.set_xticklabels([])

plt.show()
Output

Updated on: 2021-03-15T08:01:21+05:30
2K+ Views

Advertisements