
Article Categories
- All Categories
-
 Data Structure
-
 Networking
-
 RDBMS
RDBMS
-
 Operating System
-
 Java
Java
-
 MS Excel
-
 iOS
iOS
-
 HTML
HTML
-
 CSS
CSS
-
 Android
-
 Python
-
 C Programming
-
 C++
C++
-
 C#
C#
-
 MongoDB
-
 MySQL
MySQL
-
 Javascript
-
 PHP
PHP
-
 Economics & Finance
Selected Reading
How to provide shadow effect in a Plot using path_effect attribute in Matplotlib
In order to provide path effects like shadow effect in a plot or a graph, we can use the path_effect attribute.
For example, let’s see how we can use the path_effect attribute in Matplotlib add a shadow effect to a sigmoid function.
import matplotlib.pyplot as plt
import numpy as np
from matplotlib.patheffects import PathPatchEffect, SimpleLineShadow, Normal
Now let us define the size of the figure and plot the sigmoid function,
plt.style.use('seaborn-deep')
plt.subplots(figsize=(10,10))
Let us define the datapoints for the plot,
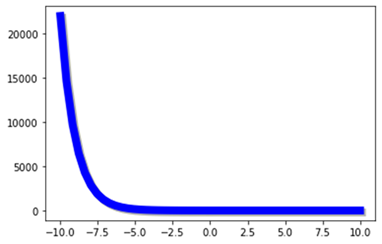
x = np.linspace(-10, 10, 50)
y = 1+ np.exp(-x))
Let us define the shadow property in the plot,
plt.plot(x, y, linewidth=8, color='blue', path_effects=
[SimpleLineShadow(), Normal()])
#Show the Plot
plt.show()
Output

Updated on: 2021-02-23T06:25:32+05:30
1K+ Views

Advertisements