
Article Categories
- All Categories
-
 Data Structure
-
 Networking
-
 RDBMS
RDBMS
-
 Operating System
-
 Java
Java
-
 MS Excel
-
 iOS
iOS
-
 HTML
HTML
-
 CSS
CSS
-
 Android
-
 Python
-
 C Programming
-
 C++
C++
-
 C#
C#
-
 MongoDB
-
 MySQL
MySQL
-
 Javascript
-
 PHP
PHP
-
 Economics & Finance
Selected Reading
How to plot with multiple color cycle using cycler property in Matplotlib
Matplotlib has a default color cycle for all the graphs and plots, however, in order to draw plots with multiple color cycles, we can use the cycler property of Matplotlib. It is used to plot repetitive patterns for the axis.
First, we will use the Object Oriented APIs such as pyplot to plot the specific visualization.
from cycler import cycler
import numpy as np
from matplotlib.backends.backend_agg import FigureCanvasAgg as FigureCanvas
from matplotlib.figure import Figure
from IPython.core.display import display
In this example, we will create two objects which will repeat the cycle after every four objects. Thus, after creating two objects, the last two will be the repeat of the first two objects.
fig = Figure()
FigureCanvas(fig)
Set the axis with facecolor, alpha, and edgecolor,
fig.set(facecolor='grey', alpha=0.2, edgecolor='m')
ax = fig.add_subplot(111)
Setting the data for plotting the graph,
x = np.array([0.4, 0.8, 1.2, 1.6, 2.0])
y = [1, 6, 6, 1, 0]
Now define the custom cycler for the color and hatch attributes and set it to the axis,
custom_cycler = cycler('color', ['g', 'blue', 'y', 'c']) + \
cycler('hatch', ['+*', 'xx', '+x', '+O.'])
ax.set_prop_cycle(custom_cycler)
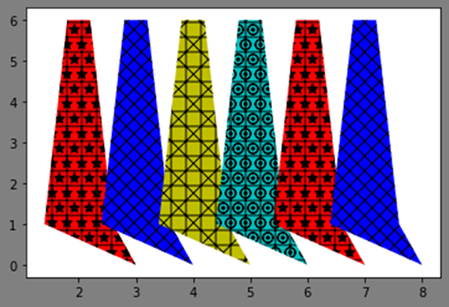
Plot the graph for the six objects,
ax.fill(x+1, y)
ax.fill(x+2, y)
ax.fill(x+3, y)
ax.fill(x+4, y)
ax.fill(x+5, y)
ax.fill(x+6, y)
Display the plot,
display(fig)
Output

Updated on: 2021-02-23T06:21:53+05:30
950 Views

Advertisements