
Article Categories
- All Categories
-
 Data Structure
-
 Networking
-
 RDBMS
RDBMS
-
 Operating System
-
 Java
Java
-
 MS Excel
-
 iOS
iOS
-
 HTML
HTML
-
 CSS
CSS
-
 Android
-
 Python
-
 C Programming
-
 C++
C++
-
 C#
C#
-
 MongoDB
-
 MySQL
MySQL
-
 Javascript
-
 PHP
PHP
-
 Economics & Finance
How to perform t Test: Paired Two Sample for Means in Excel?
It is a statistical method used to analyze and identify the mean of distinct groups. It is used by the researchers to evaluate or assess the changes or differences within the pairs of data points, by allowing them to draw conclusions about the impact of an intervention or treatment on the subjects under investigation. This article contains a brief example of the pairing of the two samples for means with the help of the Data Analysis tool pack. Users have to make the decision after interpreting the result whether to accept the null hypothesis or not.
To understand the process of applying the ttest paired two samples for means
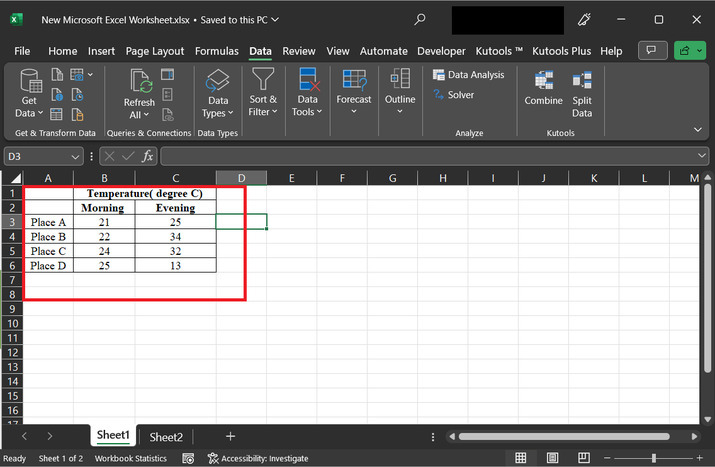
Step 1 For reference go through the sample data created in a new worksheet. This data contains values for morning and evening for different places.
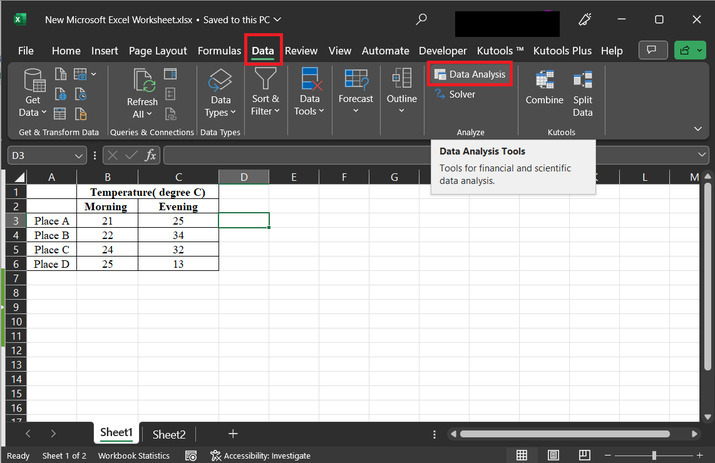
Step 2 Click on the "Data" tab, and then select the option named "Data Analysis" as highlighted in the image
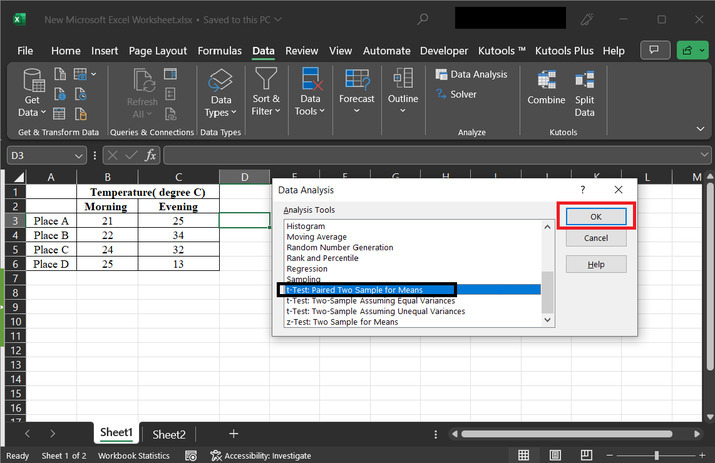
Step 3 After that different dialog box named "Data Analysis" will appear. Choose the option "ttest: paired two sample for means", and then press the "OK" button
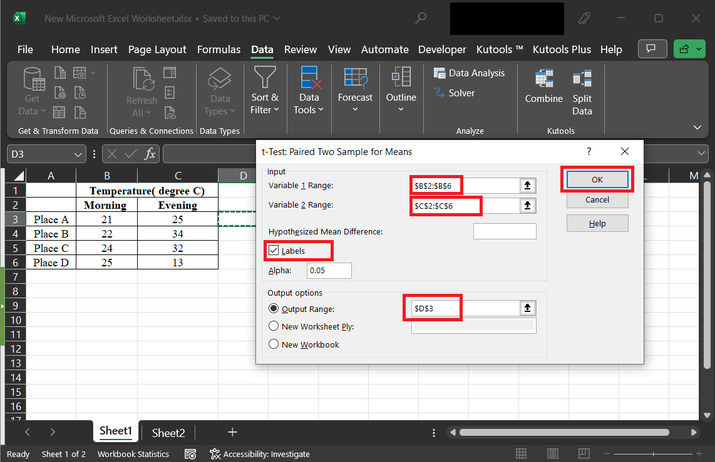
Step 4 The above step will again display a dialog box. In the variable 1 range label set data range for "B2:B6". In the variable 2 range select the "C2:C6" label. Tick the "Labels" checkbox. In the output range label set value to "D3". After that click on "OK".
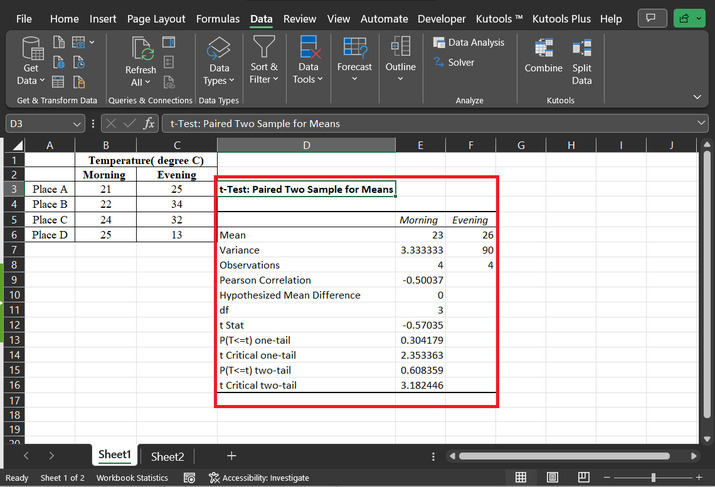
Step 5 The final result would be displayed in the selected range of the output as shown below image
Explanation
Mean of Morning (Variable 1) = 23
Mean of Evening (Variable 2) = 26

Variance of Morning = 3.333333333
Variance of Evening = 90

Number of observations in Morning = 4
Number of observations in Evening = 4

Pearson Correlation = -0.500370233
Hypothesized Mean Difference = 0 (This is the null hypothesis, assuming no difference)
Degrees of Freedom (df) = 3 (n - 1, where n is the number of observations)
t Stat = -0.570351825 (This is the calculated t-statistic)
Now, will calculate the pvalues for both onetail and twotail tests
P(T <= t) one-tail = 0.304179255
t Critical one-tail = 2.353363435

P(T <= t) two-tail = 0.608358509
t Critical two-tail = 3.182446305
Now, the user needs to interpret the results
Since users have chosen alpha (?) to be 0.05 (this indicates a 95% confidence level) users need to conduct a twotail test. By comparing the pvalue (P(T <= t) twotail) to alpha.
P(T <= t) two-tail (0.608358509) > ? (0.05)
Conclusion
We concluded that the null hypothesis would be acceptable because the alpha value is less than the computed p-value. This implies that the means of the "Morning" and "Evening" groups would differ significantly.

696 Views
