
Article Categories
- All Categories
-
 Data Structure
-
 Networking
-
 RDBMS
RDBMS
-
 Operating System
-
 Java
Java
-
 MS Excel
-
 iOS
iOS
-
 HTML
HTML
-
 CSS
CSS
-
 Android
-
 Python
-
 C Programming
-
 C++
C++
-
 C#
C#
-
 MongoDB
-
 MySQL
MySQL
-
 Javascript
-
 PHP
PHP
-
 Economics & Finance
How to perform ANOVA single factor?
The short form of Analysis of Variance is ANOVA. It is one of the most prominent statistical techniques to verify the differences among means of two or more categories. Only one independent variable would be used in the ANOVA single factor. If there is a statistically significant difference among the groups that means the null hypothesis is accepted. ANOVA is particularly useful when users have multiple groups and want to compare them simultaneously. Data Analysis Toolpak needs to be installed before testing the ANOVA technique.
To perform the ANOVA single factor
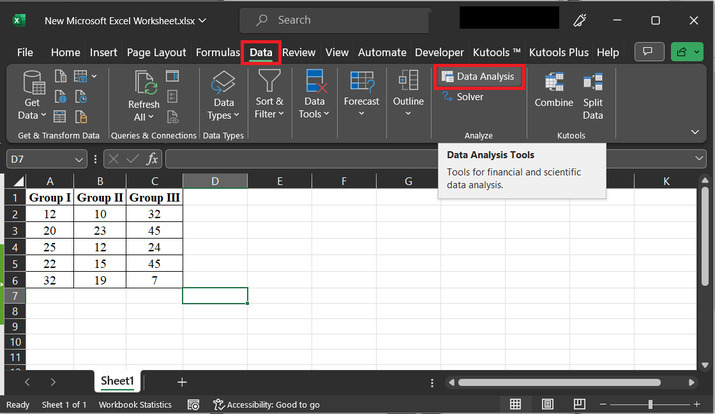
Step 1 In this example, the user will learn the process of calculating the ANOVA single factor. To do so simply create an Excel sheet. In the Excel sheet type the provided data below, to understand all the performed steps precisely. The data is highlighted in the below provided image

Step 2 After that go to the "Data" tab, and select the "Data Analysis" tab. The sample image for reference is attached below
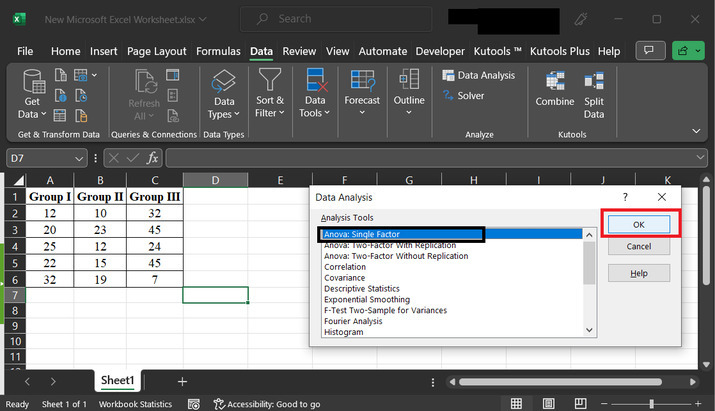
Step 3 The above step will open the "Data Analysis" dialog box. In the analysis tools dialog box, select the option "ANOVA: Single Factor", and click on the "OK" button.
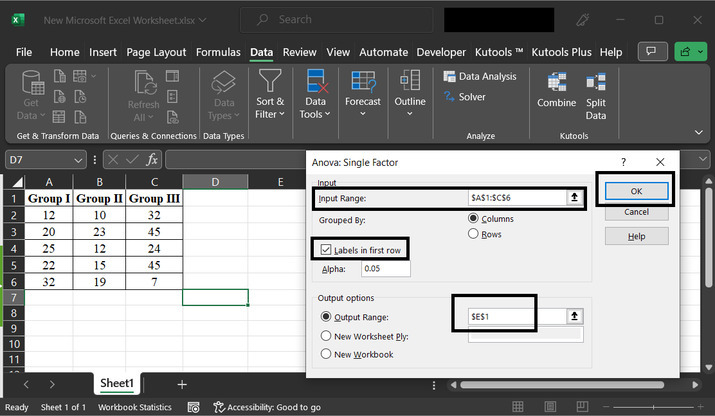
Step 4 This will open another dialog box named "Anova: Single Factor". In the dialog box, select the input label, and in the input range type the available data range. For this case, the input range will be from A1 to C6. After that click on the "Labels in first row" option. In the output range option, enter the range required by the user. here, will be taking E1 cells. Finally, click on the ?OK" button. sample image for reference is provided below
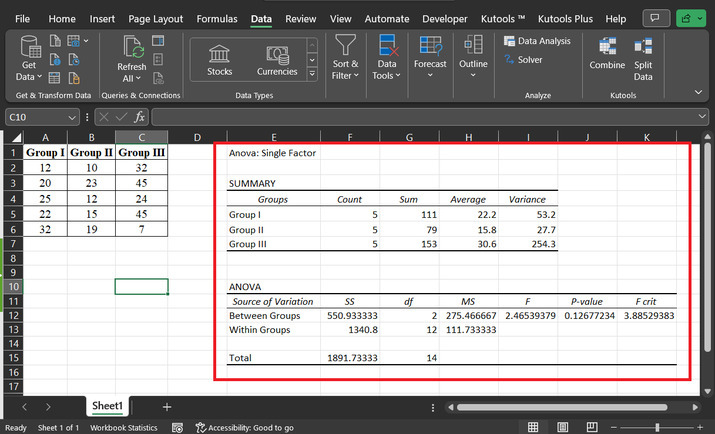
Step 5 The above step will display the Anova: single factor data, as shown below
Result interpretation
Between Groups This row represents the variation between group means.
The sum of squares (SS) for "Between Groups" is 550.933
It has 2 degrees of freedom (df).
The mean square (MS) for "Between Groups" is 275.47.
The Fstatistic is 2.47, and the pvalue is 0.127 is larger than 0.05. Thus, the null hypothesis would be recommended.
Conclusion
Therefore, based on the provided ANOVA results, there is a significant difference between the three group?s mean because the calculated pvalue is not less than 0.05 which is the Alpha level. Therefore, this test succeeds and enables the user to accept the null hypothesis and reject the alternative hypothesis.

495 Views
