
Article Categories
- All Categories
-
 Data Structure
-
 Networking
-
 RDBMS
RDBMS
-
 Operating System
-
 Java
Java
-
 MS Excel
-
 iOS
iOS
-
 HTML
HTML
-
 CSS
CSS
-
 Android
-
 Python
-
 C Programming
-
 C++
C++
-
 C#
C#
-
 MongoDB
-
 MySQL
MySQL
-
 Javascript
-
 PHP
PHP
-
 Economics & Finance
Selected Reading
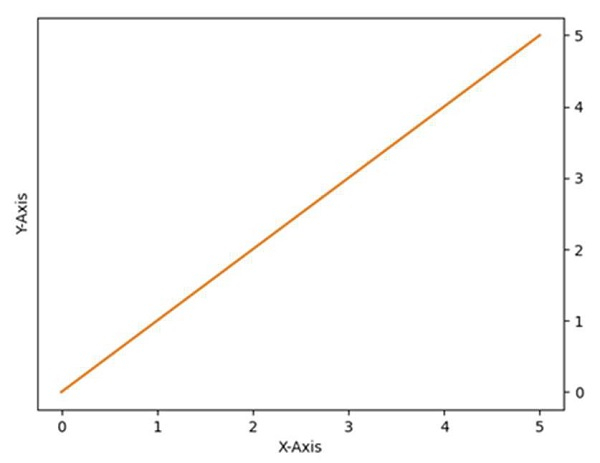
How to move the Y-axis ticks from the left side of the plot to the right side in matplotlib?
To shift the Y-axis ticks from left to right, we can perform the following steps −
Create a figure using the figure() method.
Using the above figure method, create the axis of the plot, using add_subplot(xyz), where x is row, y is column, and z is index.
To shift the Y-axis ticks from left to right, use ax.yaxis.tick_right() where ax is axis created using add_subplot(xyz) method.
Now plot the line using plot() method, with given x and y points, where x and y points can be created using np.array() method.
Set up x and y labels, e.g., X-axis and Y-axis , using xlabel and ylabel methods.
Use plt.show() to show the figure.
Example
from matplotlib import pyplot as plt
import numpy as np

f = plt.figure()
ax = f.add_subplot(111)
ax.yaxis.tick_right()
xpoints = np.array([0, 5])
ypoints = np.array([0, 5])
plt.plot(xpoints, ypoints)

plt.ylabel("Y-axis ")
plt.xlabel("X-axis ")

plt.show()
Output

Updated on: 2021-03-15T07:28:01+05:30
7K+ Views

Advertisements