
Article Categories
- All Categories
-
 Data Structure
-
 Networking
-
 RDBMS
RDBMS
-
 Operating System
-
 Java
Java
-
 MS Excel
-
 iOS
iOS
-
 HTML
HTML
-
 CSS
CSS
-
 Android
-
 Python
-
 C Programming
-
 C++
C++
-
 C#
C#
-
 MongoDB
-
 MySQL
MySQL
-
 Javascript
-
 PHP
PHP
-
 Economics & Finance
Selected Reading
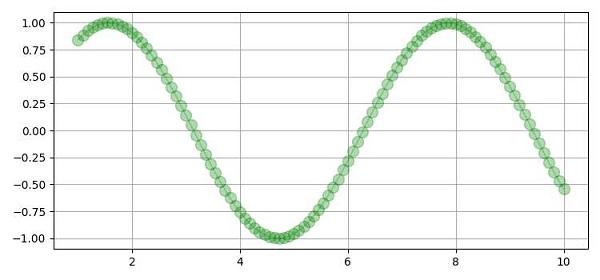
How to make the marker face color transparent without making the line transparent in Matplotlib?
To make the marker face color transparent without making the line transparent in matplotlib, we can take the following steps −
Create x_data and y_data(sin(x_data)), using numpy.
Plot curve using x_data and y_data, with marker style and marker size. By changing the alpha, we can make it transparent to opaque.
To get the essence of transparency (keeping alhpa value lesser), we can make grid lines, to see through.
To display the figure, use the show() method.
Example
import numpy as np
from matplotlib import pyplot as plt
plt.rcParams["figure.figsize"] = [7.50, 3.50]
plt.rcParams["figure.autolayout"] = True
x_data = np.linspace(1, 10, 100)
y_data = np.sin(x_data)
plt.plot(x_data, y_data, c='green', marker='o', alpha=.3, ms=10, lw=1)
plt.grid()
plt.show()
Output

Updated on: 2021-04-09T13:01:41+05:30
5K+ Views

Advertisements