
Article Categories
- All Categories
-
 Data Structure
-
 Networking
-
 RDBMS
RDBMS
-
 Operating System
-
 Java
Java
-
 MS Excel
-
 iOS
iOS
-
 HTML
HTML
-
 CSS
CSS
-
 Android
-
 Python
-
 C Programming
-
 C++
C++
-
 C#
C#
-
 MongoDB
-
 MySQL
MySQL
-
 Javascript
-
 PHP
PHP
-
 Economics & Finance
Selected Reading
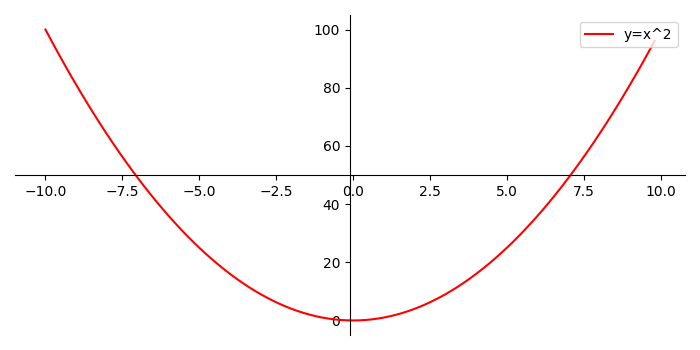
How to draw axis in the middle of a figure in Matplotlib?
To draw axis in the middle of a figure, we can take the following steps −
Create x and sqr data points using numpy.
Create a new figure, or activate an existing figure, using figure() method.
Add an axis to the figure as a part of a subplot arrangement.
Set the postion of left and bottom spines.
Set the color of the right and top spines.
Plot x and sqr, using plot() method, with label y=x2 and color=red.
Place the legend using legend() method. Set the location at upper right corner.
To display the figure, use show() method.
Example
import numpy as np
import matplotlib.pyplot as plt
plt.rcParams["figure.figsize"] = [7.00, 3.50]
plt.rcParams["figure.autolayout"] = True
x = np.arange(-10., 10., 0.2)
sqr = np.square(x)
fig = plt.figure()
ax = fig.add_subplot(1, 1, 1)
ax.spines['left'].set_position('center')
ax.spines['bottom'].set_position('center')
ax.spines['right'].set_color('none')
ax.spines['top'].set_color('none')
plt.plot(x, sqr, label="y=x^2", c='red')
plt.legend(loc=1)
plt.show()
Output

Updated on: 2021-05-06T13:27:41+05:30
5K+ Views

Advertisements