
Article Categories
- All Categories
-
 Data Structure
-
 Networking
-
 RDBMS
RDBMS
-
 Operating System
-
 Java
Java
-
 MS Excel
-
 iOS
iOS
-
 HTML
HTML
-
 CSS
CSS
-
 Android
-
 Python
-
 C Programming
-
 C++
C++
-
 C#
C#
-
 MongoDB
-
 MySQL
MySQL
-
 Javascript
-
 PHP
PHP
-
 Economics & Finance
Selected Reading
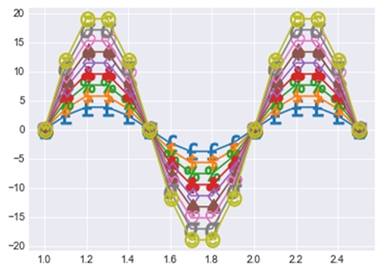
How to create custom markers on a plot in Matplotlib
To create a custom marker on a plot or graph, we use a list where we write the markers we want to see in the plot. The markers are nothing but symbols, emoji, character or any character which we want to see on the figure.
In order to create the marker, we will first import the required libraries.
import matplotlib.pyplot as plt
import numpy as np
For now, we will create a marker on a sine curve. Let us create the grid with size (12,6),
x = np.arange(1, 2.6, 0.1)
y = np.sin(2 * np.pi * x)
plt.subplots(figsize=(12,6))
Here we will create the list of custom markers,
custom_markers = ['$'+x+'$' for x in
   ['£','\$','\%','\clubsuit','\diamondsuit','\spadesuit','\heartsuit','\sigma','?" />']]
Now let us plot the sine Curve,
for i,marker in enumerate(custom_markers):
   plt.plot(x, 2*(i+2)*y, marker=marker, markersize=15)
Display the figure,
plt.show()
Output

Updated on: 2021-02-23T06:08:50+05:30
1K+ Views

Advertisements