- JavaFX - Environment
- JavaFX - Installation Using Netbeans
- JavaFX - Installation Using Eclipse
- JavaFX - Installation using Visual Studio Code
- JavaFX - Architecture
- JavaFX - Application
- JavaFX 2D Shapes
- JavaFX - 2D Shapes
- JavaFX - Drawing a Line
- JavaFX - Drawing a Rectangle
- JavaFX - Drawing a Rounded Rectangle
- JavaFX - Drawing a Circle
- JavaFX - Drawing an Ellipse
- JavaFX - Drawing a Polygon
- JavaFX - Drawing a Polyline
- JavaFX - Drawing a Cubic Curve
- JavaFX - Drawing a Quad Curve
- JavaFX - Drawing an Arc
- JavaFX - Drawing an SVGPath
- JavaFX Properties of 2D Objects
- JavaFX - Stroke Type Property
- JavaFX - Stroke Width Property
- JavaFX - Stroke Fill Property
- JavaFX - Stroke Property
- JavaFX - Stroke Line Join Property
- JavaFX - Stroke Miter Limit Property
- JavaFX - Stroke Line Cap Property
- JavaFX - Smooth Property
- Operations on 2D Objects
- JavaFX - 2D Shapes Operations
- JavaFX - Union Operation
- JavaFX - Intersection Operation
- JavaFX - Subtraction Operation
- JavaFX Path Objects
- JavaFX - Path Objects
- JavaFX - LineTo Path Object
- JavaFX - HLineTo Path Object
- JavaFX - VLineTo Path Object
- JavaFX - QuadCurveTo Path Object
- JavaFX - CubicCurveTo Path Object
- JavaFX - ArcTo Path Object
- JavaFX Color and Texture
- JavaFX - Colors
- JavaFX - Linear Gradient Pattern
- JavaFX - Radial Gradient Pattern
- JavaFX Text
- JavaFX - Text
- JavaFX Effects
- JavaFX - Effects
- JavaFX - Color Adjust Effect
- JavaFX - Color input Effect
- JavaFX - Image Input Effect
- JavaFX - Blend Effect
- JavaFX - Bloom Effect
- JavaFX - Glow Effect
- JavaFX - Box Blur Effect
- JavaFX - GaussianBlur Effect
- JavaFX - MotionBlur Effect
- JavaFX - Reflection Effect
- JavaFX - SepiaTone Effect
- JavaFX - Shadow Effect
- JavaFX - DropShadow Effect
- JavaFX - InnerShadow Effect
- JavaFX - Lighting Effect
- JavaFX - Light.Distant Effect
- JavaFX - Light.Spot Effect
- JavaFX - Point.Spot Effect
- JavaFX - DisplacementMap
- JavaFX - PerspectiveTransform
- JavaFX Transformations
- JavaFX - Transformations
- JavaFX - Rotation Transformation
- JavaFX - Scaling Transformation
- JavaFX - Translation Transformation
- JavaFX - Shearing Transformation
- JavaFX Animations
- JavaFX - Animations
- JavaFX - Rotate Transition
- JavaFX - Scale Transition
- JavaFX - Translate Transition
- JavaFX - Fade Transition
- JavaFX - Fill Transition
- JavaFX - Stroke Transition
- JavaFX - Sequential Transition
- JavaFX - Parallel Transition
- JavaFX - Pause Transition
- JavaFX - Path Transition
- JavaFX Images
- JavaFX - Images
- JavaFX 3D Shapes
- JavaFX - 3D Shapes
- JavaFX - Creating a Box
- JavaFX - Creating a Cylinder
- JavaFX - Creating a Sphere
- Properties of 3D Objects
- JavaFX - Cull Face Property
- JavaFX - Drawing Modes Property
- JavaFX - Material Property
- JavaFX Event Handling
- JavaFX - Event Handling
- JavaFX - Using Convenience Methods
- JavaFX - Event Filters
- JavaFX - Event Handlers
- JavaFX UI Controls
- JavaFX - UI Controls
- JavaFX - ListView
- JavaFX - Accordion
- JavaFX - ButtonBar
- JavaFX - ChoiceBox
- JavaFX - HTMLEditor
- JavaFX - MenuBar
- JavaFX - Pagination
- JavaFX - ProgressIndicator
- JavaFX - ScrollPane
- JavaFX - Separator
- JavaFX - Slider
- JavaFX - Spinner
- JavaFX - SplitPane
- JavaFX - TableView
- JavaFX - TabPane
- JavaFX - ToolBar
- JavaFX - TreeView
- JavaFX - Label
- JavaFX - CheckBox
- JavaFX - RadioButton
- JavaFX - TextField
- JavaFX - PasswordField
- JavaFX - FileChooser
- JavaFX - Hyperlink
- JavaFX - Tooltip
- JavaFX - Alert
- JavaFX - DatePicker
- JavaFX - TextArea
- JavaFX Charts
- JavaFX - Charts
- JavaFX - Creating Pie Chart
- JavaFX - Creating Line Chart
- JavaFX - Creating Area Chart
- JavaFX - Creating Bar Chart
- JavaFX - Creating Bubble Chart
- JavaFX - Creating Scatter Chart
- JavaFX - Creating Stacked Area Chart
- JavaFX - Creating Stacked Bar Chart
- JavaFX Layout Panes
- JavaFX - Layout Panes
- JavaFX - HBox Layout
- JavaFX - VBox Layout
- JavaFX - BorderPane Layout
- JavaFX - StackPane Layout
- JavaFX - TextFlow Layout
- JavaFX - AnchorPane Layout
- JavaFX - TilePane Layout
- JavaFX - GridPane Layout
- JavaFX - FlowPane Layout
- JavaFX CSS
- JavaFX - CSS
- Media with JavaFX
- JavaFX - Handling Media
- JavaFX - Playing Video
- JavaFX Useful Resources
- JavaFX - Quick Guide
- JavaFX - Useful Resources
- JavaFX - Discussion
JavaFX - FlowPane Layout
FlowPane Layout in JavaFX
The flow pane layout arranges all of its nodes in a flow. In a horizontal Flow Pane, elements are wrapped based on their height, while in a vertical Flow Pane, elements are wrapped according to their width.
In JavaFX, the class named FlowPane of the package javafx.scene.layout represents the Flow Pane. To create a flow pane layout within our JavaFX application, instantiate this class using any of the below constructor −
FlowPane() − It constructs a new horizontal FlowPane layout.
FlowPane(double hGap, double vGap) − It creates a new horizontal FlowPane layout with the specified hGap and vGap.
FlowPane(double hGap, double vGap, Node childNodes) − Constructs a horizontal FlowPane layout with the specified hGap, vGap and nodes.
FlowPane(Orientation orientation) − It creates a new FlowPane layout with the specified orientation. It can be either HORIZONTAL or VERTICAL.
This class contains the following properties −
| S.No | properties & Description |
|---|---|
| 1 | alignment
This property represents the alignment of the contents of the Flow pane. We can set this property using the setter method setAllignment(). |
| 2 | columnHalignment
This property represents the horizontal alignments of nodes in a vertical flow pane. |
| 3 | rowValignment
This property represents the vertical alignment of nodes in a horizontal flow pane. |
| 4 | Hgap
This property is of double type and it represents the horizontal gap between the rows/columns of a flow pane. |
| 5 | Orientation
This property represents the orientation of a flow pane. |
| 6 | Vgap
This property is of double type and it represents the vertical gap between the rows/columns of a flow pane. |
Example
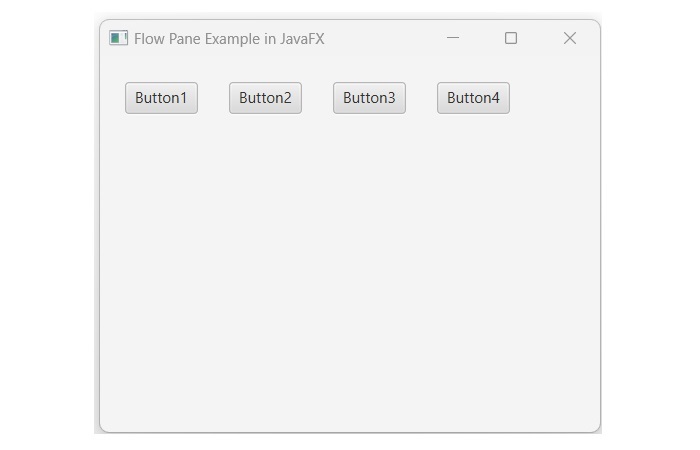
The following program is an example of the FlowPane layout. In this, we are inserting four button in the horizontal flow pane. Save this code in a file with the name FlowPaneExample.java.
import javafx.application.Application;
import javafx.geometry.Insets;
import javafx.scene.Scene;
import javafx.scene.control.Button;
import javafx.scene.layout.FlowPane;
import javafx.scene.shape.Sphere;
import javafx.stage.Stage;

public class FlowPaneExample extends Application {
   @Override
   public void start(Stage stage) {
      //Creating button1
      Button button1 = new Button("Button1");

      //Creating button2
      Button button2 = new Button("Button2");

      //Creating button3
      Button button3 = new Button("Button3");

      //Creating button4
      Button button4 = new Button("Button4");

      //Creating a Flow Pane
      FlowPane flowPane = new FlowPane();

      //Setting the horizontal gap between the nodes
      flowPane.setHgap(25);

      //Setting the margin of the pane
      flowPane.setMargin(button1, new Insets(20, 0, 20, 20));

      //Adding all the nodes to the flow pane
      flowPane.getChildren().addAll(button1, button2, button3, button4);

      //Creating a scene object
      Scene scene = new Scene(flowPane, 400, 300);

      //Setting title to the Stage
      stage.setTitle("Flow Pane Example in JavaFX");

      //Adding scene to the stage
      stage.setScene(scene);

      //Displaying the contents of the stage
      stage.show();
   }
   public static void main(String args[]){
      launch(args);
   }
}
Compile and execute the saved java file from the command prompt using the following commands.
javac --module-path %PATH_TO_FX% --add-modules javafx.controls FlowPaneExample.java
java --module-path %PATH_TO_FX% --add-modules javafx.controls FlowPaneExample
Output
On executing, the above program generates a JavaFX window as shown below.
Example
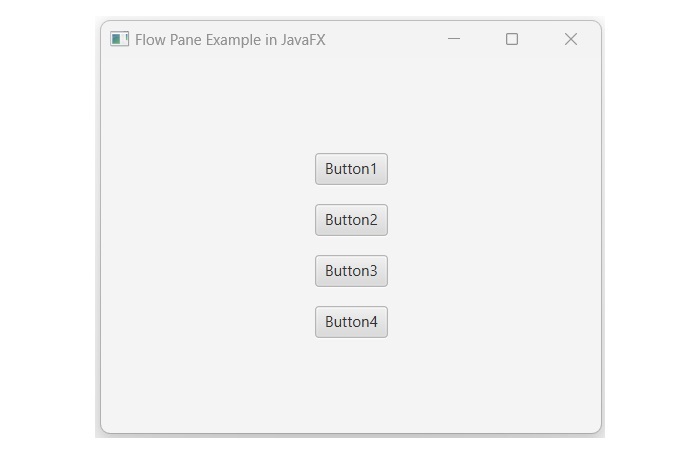
In the following example, we are going to create a FlowPane with vertical orientation. To set the orientation, we will use the parameterized constructor of the FlowPane class by passing the Orientation.VERTICAL enum value as an argument. Save this code in a file with the name JavafxFlowpane.java.
import javafx.application.Application;
import javafx.geometry.Orientation;
import javafx.geometry.Pos;
import javafx.scene.Scene;
import javafx.scene.control.Button;
import javafx.scene.layout.FlowPane;
import javafx.scene.shape.Sphere;
import javafx.stage.Stage;

public class JavafxFlowpane extends Application {
   @Override
   public void start(Stage stage) {
      //Creating button1
      Button button1 = new Button("Button1");

      //Creating button2
      Button button2 = new Button("Button2");

      //Creating button3
      Button button3 = new Button("Button3");

      //Creating button4
      Button button4 = new Button("Button4");

      //Creating a Flow Pane
      FlowPane flowPane = new FlowPane(Orientation.VERTICAL);

      //Setting the horizontal gap between the nodes
      flowPane.setVgap(15);

      //Setting the margin of the pane
      flowPane.setAlignment(Pos.CENTER);

      //Adding all the nodes to the flow pane
      flowPane.getChildren().addAll(button1, button2, button3, button4);

      //Creating a scene object
      Scene scene = new Scene(flowPane, 400, 300);

      //Setting title to the Stage
      stage.setTitle("Flow Pane Example in JavaFX");

      //Adding scene to the stage
      stage.setScene(scene);

      //Displaying the contents of the stage
      stage.show();
   }
   public static void main(String args[]){
      launch(args);
   }
}
To compile and execute the saved java file from the command prompt, use the following commands −
javac --module-path %PATH_TO_FX% --add-modules javafx.controls JavafxFlowpane.java
java --module-path %PATH_TO_FX% --add-modules javafx.controls JavafxFlowpane
Output
When we execute the above Java program, it will generate a JavaFX window displaying the following output −