
Article Categories
- All Categories
-
 Data Structure
-
 Networking
-
 RDBMS
RDBMS
-
 Operating System
-
 Java
Java
-
 MS Excel
-
 iOS
iOS
-
 HTML
HTML
-
 CSS
CSS
-
 Android
-
 Python
-
 C Programming
-
 C++
C++
-
 C#
C#
-
 MongoDB
-
 MySQL
MySQL
-
 Javascript
-
 PHP
PHP
Selected Reading
How to create a draggable legend in Matplotlib?
To create a draggable legend in matplotlib, we can take the following steps −
Create two lines, line1 and line2, using plot() method.
Place the legend for plot line1 and line2 with ordered lables at location 1, using legend() method.
To create a draggable legend, use set_draggable() method, where state=True. If state=False, then we can't drag the legend.
To display the figure, use show() method.
Example
from matplotlib import pyplot as plt
plt.rcParams["figure.figsize"] = [7.00, 3.50]
plt.rcParams["figure.autolayout"] = True
line1, = plt.plot([1, 2, 3])
line2, = plt.plot([3, 2, 1])
leg = plt.legend([line2, line1], ["line 2", "line 1"], loc=1)
leg.set_draggable(state=True)
plt.show()
Output
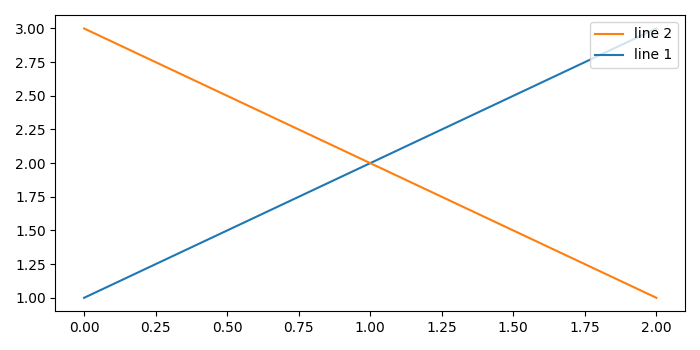
On the output window, you can drag the legend around with the mouse.

Updated on: 2021-05-06T12:52:08+05:30
2K+ Views

Advertisements