
Article Categories
- All Categories
-
 Data Structure
-
 Networking
-
 RDBMS
RDBMS
-
 Operating System
-
 Java
Java
-
 MS Excel
-
 iOS
iOS
-
 HTML
HTML
-
 CSS
CSS
-
 Android
-
 Python
-
 C Programming
-
 C++
C++
-
 C#
C#
-
 MongoDB
-
 MySQL
MySQL
-
 Javascript
-
 PHP
PHP
-
 Economics & Finance
How To Count Number Of Peaks In A Column Of Data In Excel?
If you work with data in Excel, you may often need to analyse trends and patterns within your data. One important metric to consider is the number of peaks, which refers to the maximum values in a set of data. Peaks can help you identify changes in trends, detect outliers, and make important decisions. Counting the number of peaks in a column of data can be a useful technique for analysing data. However, manually identifying peaks in a large set of data can be a time-consuming and error-prone task. Fortunately, Excel provides several tools that can help you quickly and accurately count the number of peaks in your data.
In this tutorial, we'll explore different methods for identifying and counting peaks in Excel. We'll cover both manual and automated methods, including using built-in functions and creating custom formulas. Whether you're a beginner or an advanced Excel user, this tutorial will help you master the skill of counting peaks in your data.
Count Number Of Peaks In A Column Of Data
Here we can get the result directly using a single formula. So let us see a simple process to know how you can count the number of peaks in a column of data in Excel.
Step 1
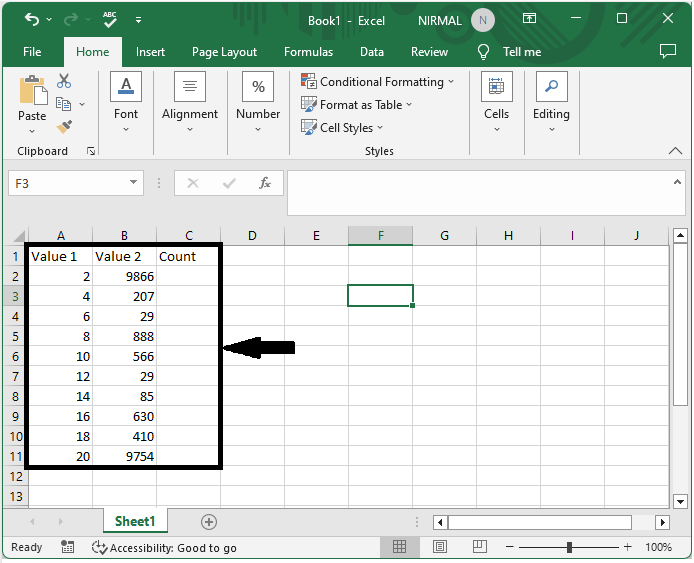
Consider an Excel sheet where you have a list of two values similar to the below image.
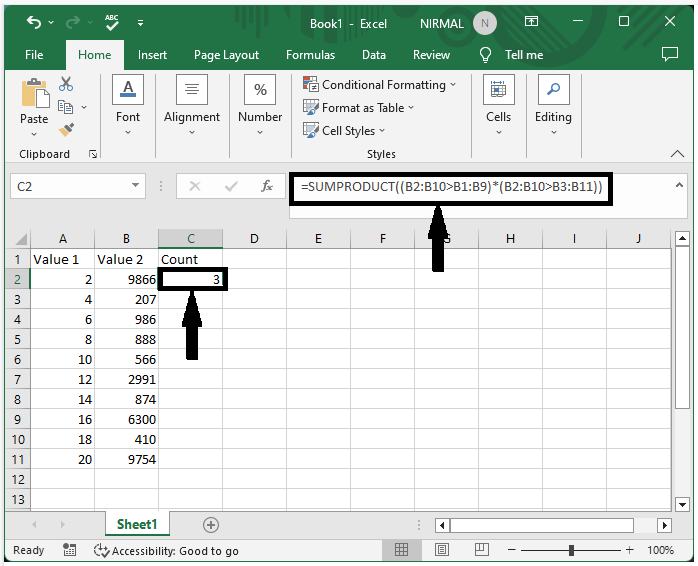
First, click on an empty cell, in our case cell C2, and enter the formula as
=SUMPRODUCT((B2:B10>B1:B9)*(B2:B10>B3:B11)) and click enter to get the result. In the formula, B2:B10 is the range of cells containing a list of values.
Empty cell > Formula > Enter.
This is how we can count the number of peaks in a column of data in Excel.
Conclusion
In this tutorial, we used a simple example to demonstrate how you can count the number of peaks in a column of data in Excel to highlight a particular set of data.

1K+ Views
