
Article Categories
- All Categories
-
 Data Structure
-
 Networking
-
 RDBMS
RDBMS
-
 Operating System
-
 Java
Java
-
 MS Excel
-
 iOS
iOS
-
 HTML
HTML
-
 CSS
CSS
-
 Android
-
 Python
-
 C Programming
-
 C++
C++
-
 C#
C#
-
 MongoDB
-
 MySQL
MySQL
-
 Javascript
-
 PHP
PHP
-
 Economics & Finance
How to Convert a Range to a Table or Vice Versa in Excel?
There are many special features in Excel that are only available in tables and can't be applied to normal ranges of data. Operations like sorting and inserting are some of the simplest processes in case of tables. Sometimes, we need to convert a range of data to a table to access those features.
Read this tutorial to learn how you can convert a range of data to a table and a table to a range of data in Excel. It is a very simple process. A table will also help us understand our data in a more precise and faster way.
Converting a Range to a Table in Excel
Here we will create the table for the given data. Let's go over a simple procedure for converting a range of data to a table in Excel.
Step 1
Let us consider an Excel sheet where the data in the sheet is similar to the data shown in the below image.
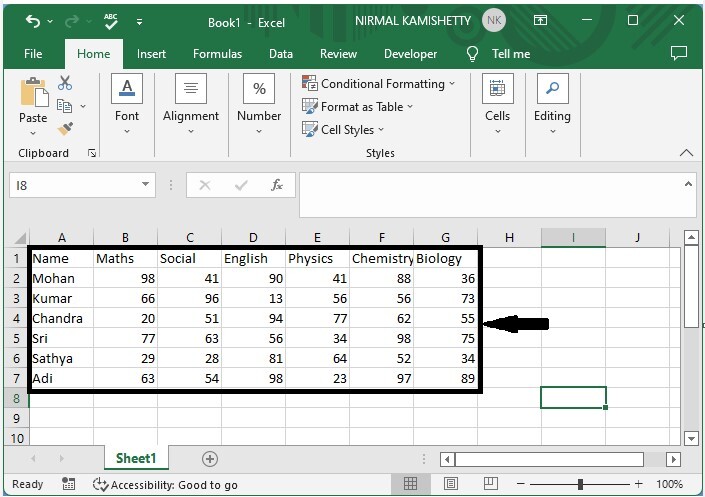
To convert the range into a table, select the data, then click "Insert," "Table," and "OK," and our table will be successfully created, as shown in the image below.
Select data > Insert > Table > OK
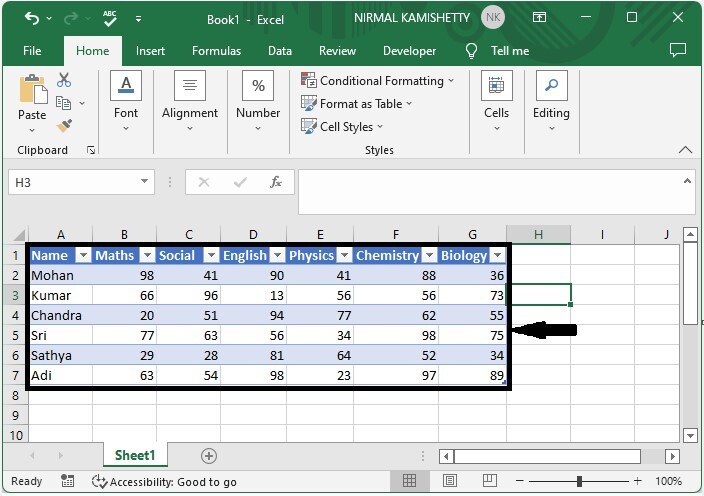
The top row of the selected data will always be converted into the table headings.
Converting a Range to a Table in Excel
Here, we will directly use the right-click menu to complete the task. Let's go over a simple procedure for converting a range of data to a table in Excel.
Step 1
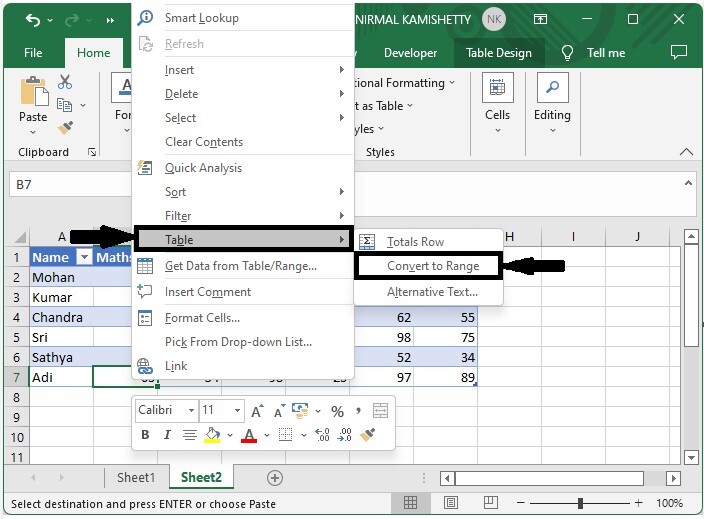
Let us consider the same table, which is the result of the above example.
Select any cell in the table by clicking on it, then, as shown in the image below, use the right-click menu to select Table > Change to Range. Then click OK on the confirmation pop-up that appears.
Right click > Table > Change to range > OK
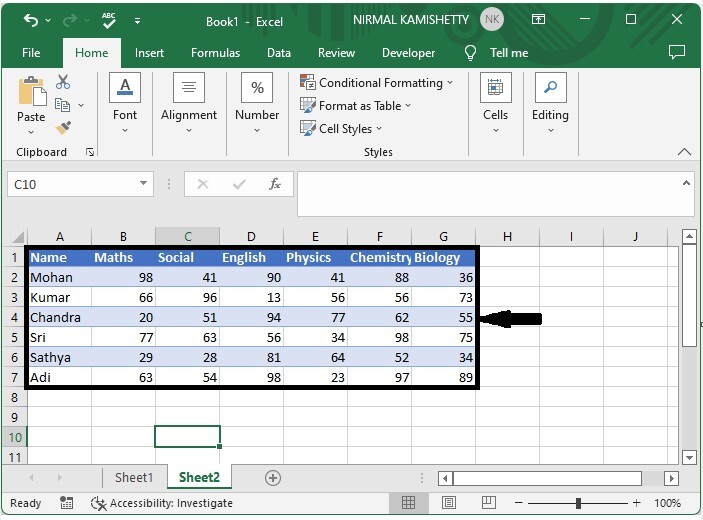
Our outcome will look like the image shown below.
Conclusion
In this tutorial, we used a simple example to demonstrate how you can convert a range to a table in Excel.

2K+ Views
