
Article Categories
- All Categories
-
 Data Structure
-
 Networking
-
 RDBMS
RDBMS
-
 Operating System
-
 Java
Java
-
 MS Excel
-
 iOS
iOS
-
 HTML
HTML
-
 CSS
CSS
-
 Android
-
 Python
-
 C Programming
-
 C++
C++
-
 C#
C#
-
 MongoDB
-
 MySQL
MySQL
-
 Javascript
-
 PHP
PHP
-
 Economics & Finance
Selected Reading
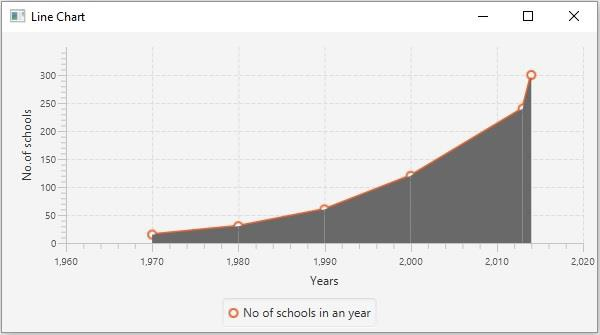
How to color the plotted area of a JavaFX xy-chart?
All the XY charts have an abstract method named layoutPlotChildren(). To color the plotted area (region) of an XY chart one way is to override this method. Generally, it is called to update and layout the plot of children.
In the body of this method −
Get the series data.
Extract the plotted points.
Draw a polygon in the plotted area using the extracted points.
Set the desired color to the polygon.
Example
import javafx.application.Application;
import javafx.collections.FXCollections;
import javafx.collections.ObservableList;
import javafx.scene.Scene;
import javafx.stage.Stage;
import javafx.scene.chart.LineChart;
import javafx.scene.chart.NumberAxis;
import javafx.scene.chart.XYChart;
import javafx.scene.chart.XYChart.Series;
import javafx.scene.layout.StackPane;
import javafx.scene.paint.Color;
import javafx.scene.shape.Polygon;
public class EnhancingGraphPlot extends Application {
   public void start(Stage stage) {
      //Defining the x axis
      NumberAxis xAxis = new NumberAxis(1960, 2020, 10);
      xAxis.setLabel("Years");
      //Defining the y axis
      NumberAxis yAxis = new NumberAxis (0, 350, 50);
      yAxis.setLabel("No.of schools");
      //Preparing the data for the X-Y chart
      XYChart.Series<Number,Number> series = new XYChart.Series<Number,Number>();
      series.setName("No of schools in an year");
      series.getData().add(new XYChart.Data<Number,Number>(1970, 15));
      series.getData().add(new XYChart.Data<Number,Number>(1980, 30));
      series.getData().add(new XYChart.Data<Number,Number>(1990, 60));
      series.getData().add(new XYChart.Data<Number,Number>(2000, 120));
      series.getData().add(new XYChart.Data<Number,Number>(2013, 240));
      series.getData().add(new XYChart.Data<Number,Number>(2014, 300));
      //Creating data
      ObservableList<Series<Number, Number>> data =
      FXCollections.observableArrayList(series);
      //Creating the Line chart
      LineChart<Number,Number> lineChart = new LineChart<Number,Number>(xAxis, yAxis, data ) {
         //Overriding the layoutPlotChildren method
         protected void layoutPlotChildren() {
            super.layoutPlotChildren();
            Series<Number,Number> series = (Series<Number,Number>)
            getData().get(0);
            ObservableList<Data<Number,Number>> listOfData = series.getData();
            for(int i = 0; i < listOfData.size()-1; i++) {
               double x1 = getXAxis().getDisplayPosition(listOfData.get(i).getXValue());
               double y1 = getYAxis().getDisplayPosition(0);
               double x2 = getXAxis().getDisplayPosition(listOfData.get((i + 1)).getXValue());
               double y2 = getYAxis().getDisplayPosition(0);
               Polygon polygon = new Polygon();
               polygon.getPoints().addAll(new Double[]{
                  x1,y1, x1, getYAxis().getDisplayPosition(listOfData.get(i).getYValue()), x2,getYAxis().getDisplayPosition(listOfData.get((i+1)).getYValue()), x2,y2
               });
               getPlotChildren().add(polygon);
               polygon.toFront();
               polygon.setFill(Color.DIMGRAY);
            }
         }
      };
      //Adding the line chart to stack pane
      StackPane pane = new StackPane(lineChart);
      //Setting the scene
      Scene scene = new Scene(pane, 595, 300);
      stage.setTitle("Line Chart");
      stage.setScene(scene);
      stage.show();
   }
   public static void main(String args[]){
      launch(args);
   }
}
Output

Updated on: 2020-05-19T12:27:56+05:30
571 Views

Advertisements