
Article Categories
- All Categories
-
 Data Structure
-
 Networking
-
 RDBMS
RDBMS
-
 Operating System
-
 Java
Java
-
 MS Excel
-
 iOS
iOS
-
 HTML
HTML
-
 CSS
CSS
-
 Android
-
 Python
-
 C Programming
-
 C++
C++
-
 C#
C#
-
 MongoDB
-
 MySQL
MySQL
-
 Javascript
-
 PHP
PHP
-
 Economics & Finance
How to change the color and font of the tick marks in a JavaFX XY chart?
The javafx.scene.XYChart class is the base class of all the charts that are plotted in an x-y pane. By instantiating the subclasses of this class you can create various XY charts namely − line chart, area chart, bar chart, pie chart, bubble chart, scatter chart, etc.
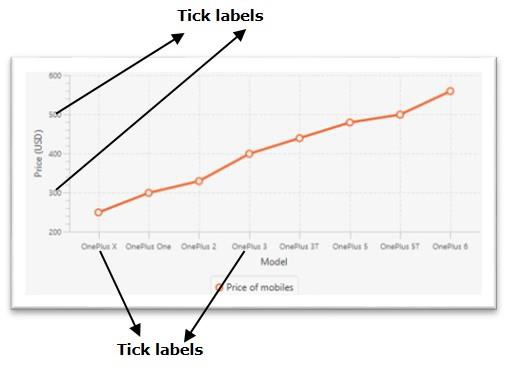
In the XY chart, the given data points are plotted on an XY plane. Along the x and y axes, you will have the tick marks and tick labels. The labels specify the names (or numbers) of the values.
Changing the color of the tick labels
The javafx.scene.chart.Axis class (abstract) is the base class of all the axes in XY charts. To create X and Y axes you need to instantiate subclasses of these classes
The NumberAxis class is used to create an axis for numerical values and the CategoryAxis class is used to create axis for string categories.
Two of the properties of the Axis class are −
tickLabelFill − This property specifies the fill color of all the tick labels in the current axis. You can set the value of this property using the setTickLabelFill() method.
tickLabelFont − This property specifies the font of all the tick labels in the current axis. You can set the value of this property using the setTickLabelFont() method.
You can set the required color and font to the tick labels of an XY chart using these methods.
Example
import javafx.application.Application;
import javafx.geometry.Insets;
import javafx.scene.Scene;
import javafx.scene.chart.BubbleChart;
import javafx.stage.Stage;
import javafx.scene.chart.NumberAxis;
import javafx.scene.chart.XYChart;
import javafx.scene.layout.StackPane;
import javafx.scene.paint.Color;
public class BubbleChart_Color extends Application {
   public void start(Stage stage) {
      //Creating X and Y axes
      NumberAxis xAxis = new NumberAxis(0, 90, 10);
      NumberAxis yAxis = new NumberAxis(20, 90, 10);
      //Creating labels to the axes
      xAxis.setLabel("Age");
      yAxis.setLabel("Weight");
      //Creating the Bubble chart
      BubbleChart bubbleChart = new BubbleChart(xAxis, yAxis);
      //Preparing data for bubble chart
      XYChart.Series series = new XYChart.Series();
      series.getData().add(new XYChart.Data(10, 30, 4));
      series.getData().add(new XYChart.Data(25, 40, 5));
      series.getData().add(new XYChart.Data(40, 50, 6));
      series.getData().add(new XYChart.Data(55, 60, 8));
      series.getData().add(new XYChart.Data(70, 70, 9));
      //series.getData().add(new XYChart.Data(85, 80, 12));
      //Setting the data to bar chart
      bubbleChart.getData().add(series);
      //Setting name to the bubble chart
      series.setName("work");
      //Setting color to tick labels
      xAxis.setTickLabelFill(Color.RED);
      yAxis.setTickLabelFill(Color.RED);
      //Creating a stack pane to hold the chart
      StackPane pane = new StackPane(bubbleChart);
      pane.setPadding(new Insets(15, 15, 15, 15));
      pane.setStyle("-fx-background-color: BEIGE");
      //Setting the Scene
      Scene scene = new Scene(pane, 595, 350);
      stage.setTitle("Bubble Chart");
      stage.setScene(scene);
      stage.show();
   }
   public static void main(String args[]){
      launch(args);
   }
}
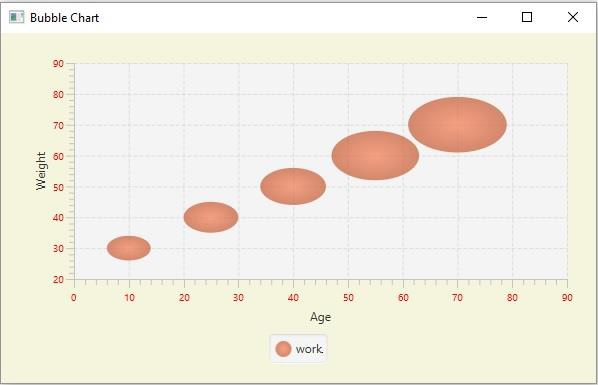
Output

927 Views
