
Article Categories
- All Categories
-
 Data Structure
-
 Networking
-
 RDBMS
RDBMS
-
 Operating System
-
 Java
Java
-
 MS Excel
-
 iOS
iOS
-
 HTML
HTML
-
 CSS
CSS
-
 Android
-
 Python
-
 C Programming
-
 C++
C++
-
 C#
C#
-
 MongoDB
-
 MySQL
MySQL
-
 Javascript
-
 PHP
PHP
-
 Economics & Finance
Selected Reading
How to change the aspect ratio of a plot in ggplot2 in R?
The aspect ratio of a chart can be changed in ggplot2 and this will be useful if we want a smaller image of the chart. Sometimes, we don’t have large space where the chart will be pasted therefore this functionality becomes useful. Mostly, in research reports we see charts that are of small size, hence R becomes helpful to create charts that can be pasted in the desired space. This can be done with the help of theme function.
Example
Consider the below data frame −
> set.seed(100)
> x<-rpois(30,2)
> df<-data.frame(x)
Loading the ggplot2 package −
> library(ggplot2)
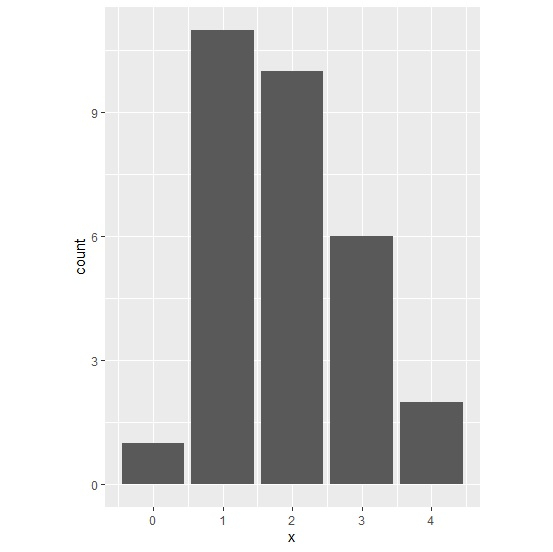
Creating the plot with aspect ratio 4/3 −
> ggplot(df,aes(x))+
+ geom_bar()+
+ theme(aspect.ratio=4/3)
Output
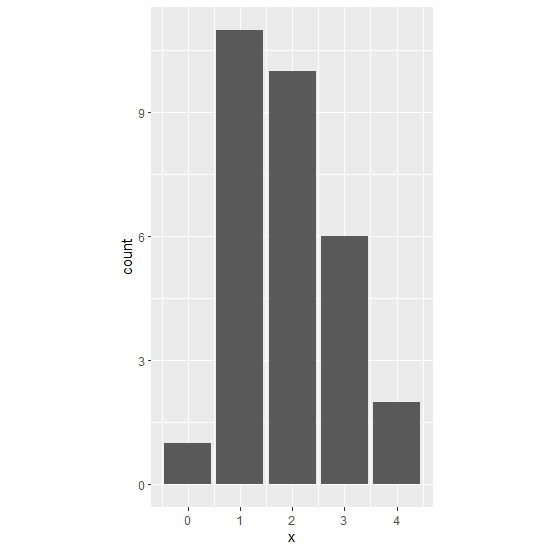
Creating the plot with aspect ratio 16/9 −
> ggplot(df,aes(x))+
+ geom_bar()+
+ theme(aspect.ratio=16/9)
Output
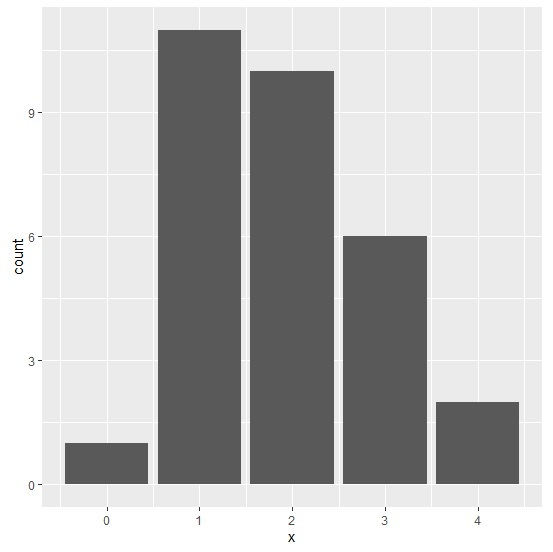
Creating the plot with aspect ratio 1, it gives us a square form −
> ggplot(df,aes(x))+
+ geom_bar()+
+ theme(aspect.ratio=1)
Output

Updated on: 2020-08-10T12:30:46+05:30
7K+ Views

Advertisements