
- MS Excel Basics
- Excel - Home
- Excel - Getting Started
- Excel - Explore Window
- Excel - Backstage
- Excel - Entering Values
- Excel - Move Around
- Excel - Save Workbook
- Excel - Create Worksheet
- Excel - Copy Worksheet
- Excel - Hiding Worksheet
- Excel - Delete Worksheet
- Excel - Close Workbook
- Excel - Open Workbook
- Excel - Context Help
- Editing Worksheet
- Excel - Insert Data
- Excel - Select Data
- Excel - Delete Data
- Excel - Move Data
- Excel - Rows & Columns
- Excel - Copy & Paste
- Excel - Find & Replace
- Excel - Spell Check
- Excel - Zoom In-Out
- Excel - Special Symbols
- Excel - Insert Comments
- Excel - Add Text Box
- Excel - Undo Changes
- Formatting Cells
- Excel - Setting Cell Type
- Excel - Setting Fonts
- Excel - Text Decoration
- Excel - Rotate Cells
- Excel - Setting Colors
- Excel - Text Alignments
- Excel - Merge & Wrap
- Excel - Borders and Shades
- Excel - Apply Formatting
- Formatting Worksheets
- Excel - Sheet Options
- Excel - Adjust Margins
- Excel - Page Orientation
- Excel - Header and Footer
- Excel - Insert Page Breaks
- Excel - Set Background
- Excel - Freeze Panes
- Excel - Conditional Format
- Working with Formula
- Excel - Creating Formulas
- Excel - Copying Formulas
- Excel - Formula Reference
- Excel - Using Functions
- Excel - Builtin Functions
- Advanced Operations
- Excel - Data Filtering
- Excel - Data Sorting
- Excel - Using Ranges
- Excel - Data Validation
- Excel - Using Styles
- Excel - Using Themes
- Excel - Using Templates
- Excel - Using Macros
- Excel - Adding Graphics
- Excel - Cross Referencing
- Excel - Printing Worksheets
- Excel - Email Workbooks
- Excel- Translate Worksheet
- Excel - Workbook Security
- Excel - Data Tables
- Excel - Pivot Tables
- Excel - Simple Charts
- Excel - Pivot Charts
- Excel - Keyboard Shortcuts
- MS Excel Resources
- Excel - Quick Guide
- Excel - Useful Resources
- Excel - Discussion
How to calculate standard deviation in Excel?
A number's standard deviation gives you an idea of how much it deviates from the average of all the values in the sample. The fact that each of the numbers is identical to the others indicates that there is no variance. As a direct consequence of this, the numbers have just a standard deviation that is equal to zero.
The STDEV function has been around for a very long time. The new STEDV.S function, which is included in Microsoft Excel and provides the same exact result, is the one that the software company advises using.
We can compute the standard deviation by making use of the STEDV.S function.
STDEV.S(number1,[number2],…)
Here,
Number 1 is an essential part of the formula and must be included. The first element in the sample of a number, which matches to the first number argument, is the element 1. Alternately, you may use a named range, a singular array, or even a reference to an array in place of the parameters that were previously separated by commas.
Number2 is an optional parameter. You are allowed to utilise an extra 254 arguments if you so like.
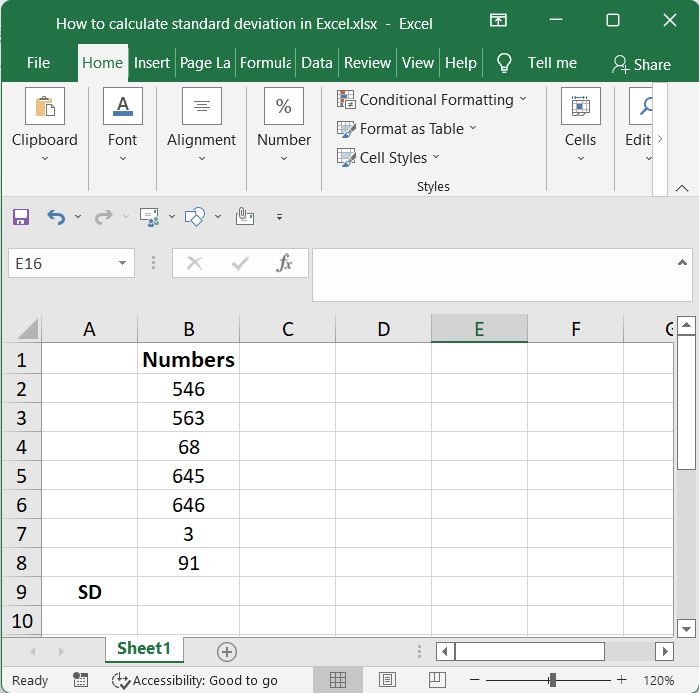
Step 1
Now that we have some numbers of data, we can compute the standard deviation by making use of the STEDV.S function. This will need that we have certain numbers of data.
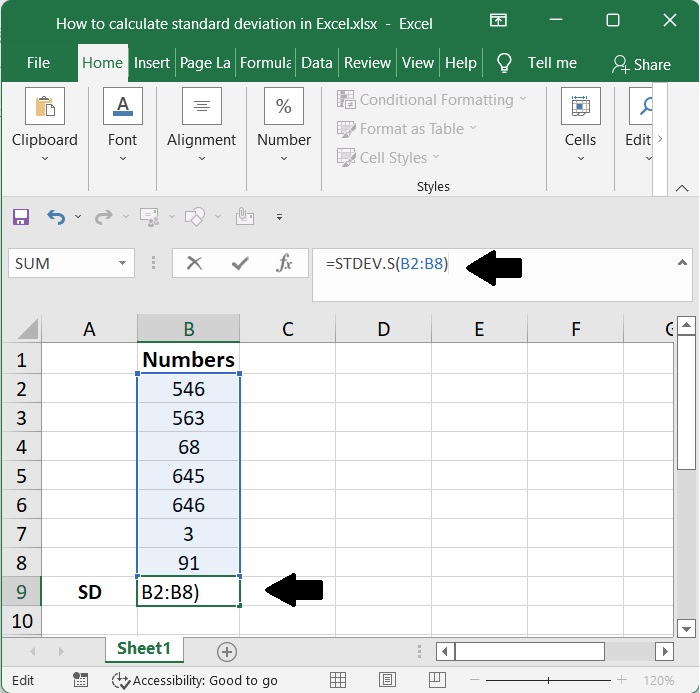
Step 2
Applying the following formula to this data set will allow you to compute the standard deviation of the data
=STDEV.S(B2:B8)
Calculate the standard deviation of the numbers B2 through B8 by making use of the STDEV.S function. Following that, you may check your result by pressing the enter key.
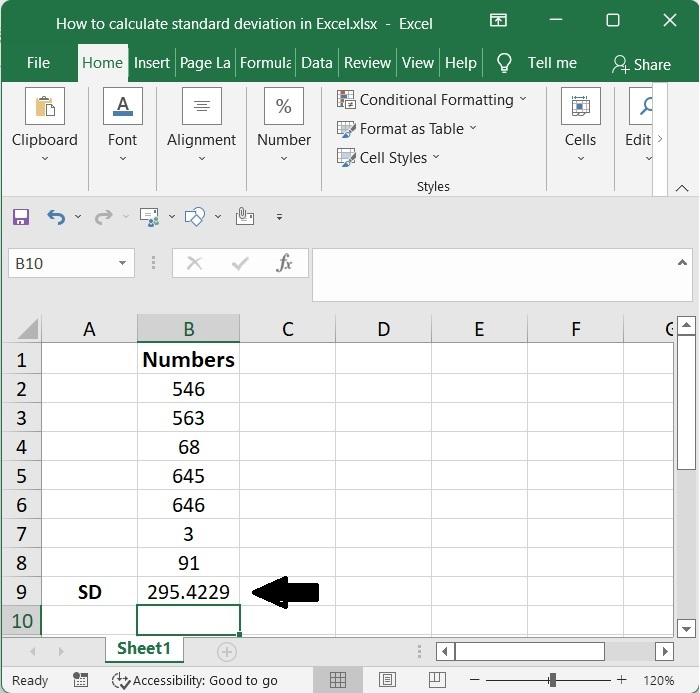
Step 3
Here is a screenshot of the standard deviation, (here SD), swing in the bellow plot.

Conclusion
In this tutorial, we used a simple example to demonstrate how you can calculate standard deviation in Excel.
- Related Articles
- C++ Program to Calculate Standard Deviation
- Java Program to Calculate Standard Deviation
- Golang Program to Calculate Standard Deviation
- Swift Program to Calculate Standard Deviation
- Python Program to Calculate Standard Deviation
- C program to calculate the standard deviation
- How to calculate standard error of the mean in Excel?
- Generate random numbers by giving certain mean and standard deviation in Excel
- Python - Calculate the standard deviation of a column in a Pandas DataFrame
- Variance and Standard Deviation
- How to create boxplot using mean and standard deviation in R?
- How to find the moving standard deviation in an R matrix?
- Plot mean and standard deviation in Matplotlib
- How to find mean and standard deviation from frequency table in R?
- How to divide the matrix rows by row standard deviation in R?
