
Article Categories
- All Categories
-
 Data Structure
-
 Networking
-
 RDBMS
RDBMS
-
 Operating System
-
 Java
Java
-
 MS Excel
-
 iOS
iOS
-
 HTML
HTML
-
 CSS
CSS
-
 Android
-
 Python
-
 C Programming
-
 C++
C++
-
 C#
C#
-
 MongoDB
-
 MySQL
MySQL
-
 Javascript
-
 PHP
PHP
-
 Economics & Finance
How to add border line below when value changes in an Excel column?
Worksheets created in Excel can often be difficult to comprehend since they include a lot of information and have a complex structure. Putting a border around the cells in a worksheet can help you differentiate between the various parts, draw attention to certain data like as column headings or total rows, and make your spreadsheets more presentable and visually appealing. In Excel, a border is a line that surrounds an individual cell or a group of cells. In most cases, cell boundaries are utilized to highlight a particular region of a spreadsheet in order to draw attention to that region. By maintaining borders, we are able to frame any data and give it a defined boundary in an appropriate manner. You can highlight specific values by outlining summarized values or separating data into ranges of cells additionally, you can place borders around individual cells.
Add Border Line When Value Changes With VBA
Excel does not have a built-in function that will assist you in adding a border line below when the value changes; however, there is a VBA code that will do this for you.
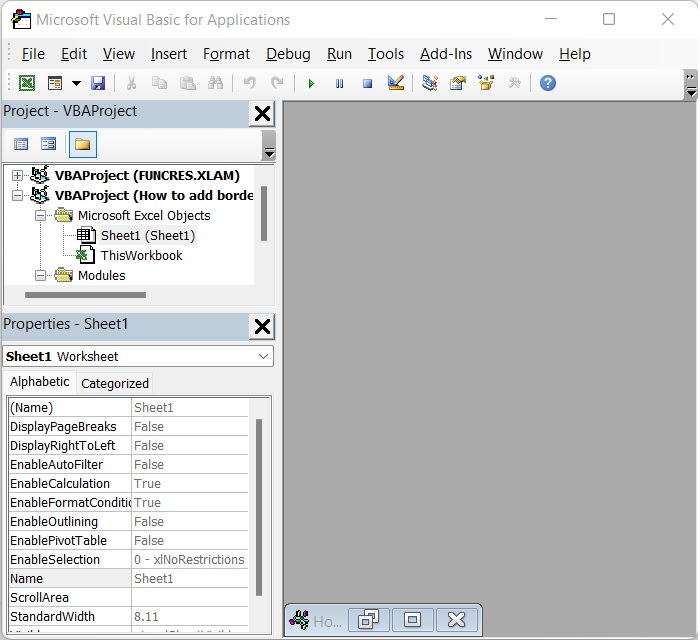
Step 1
Open an excel sheet and Press Alt and F11 key (Alt+F11) to open Microsoft Visual Basic for Application windows. See the below given image.
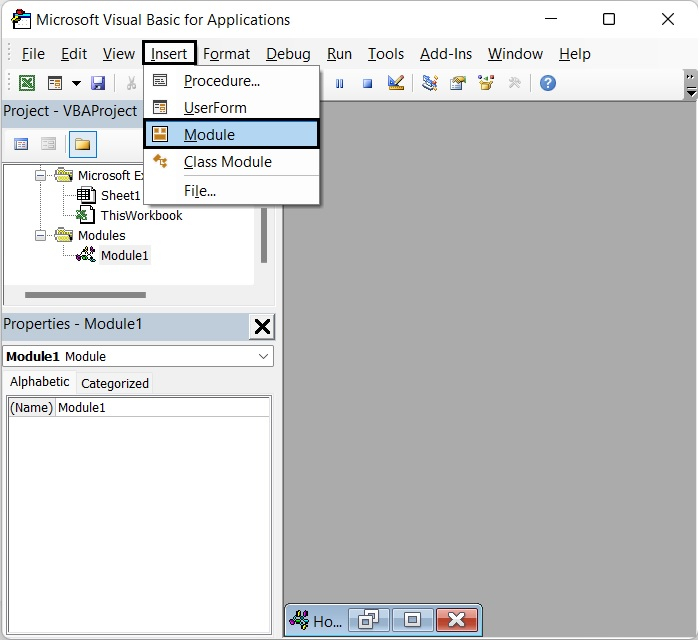
Step 2
After that, select Insert > Module from the menu bar to bring up the popup Module window. See the below given image.
Step 3
After opening the Module Window, then type the following VBA code in it.
Sub AddBorderLineWhenValueChanges()
   Application.ScreenUpdating = False
   Dim LastRow As Long
   Dim xrg As Range
   LastRow = Cells.Find("*", SearchOrder:=xlByRows, SearchDirection:=xlPrevious).Row
   For Each xrg In Range("A2:A" & LastRow)
      If xrg <> xrg.Offset(1, 0) Then
         Range("A" & xrg.Row & ":B" & xrg.Row).Borders(xlEdgeBottom).LineStyle = xlContinuous
      End If
   Next xrg
   Application.ScreenUpdating = True
End Sub
See the below given image.
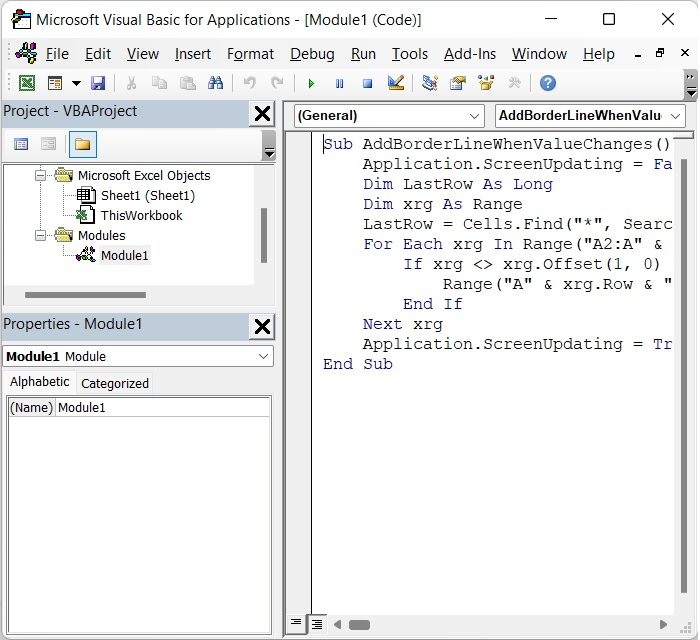
In our example, we have added the range A & B and A2:A is the selected cell. You can change it as per your need.
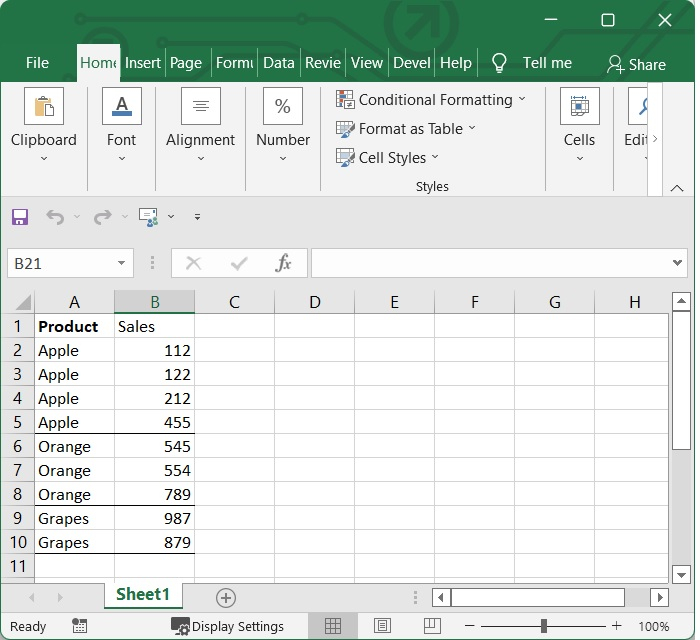
To run the code, press the F5 key. Then, when the value in the selection A2:A changes, the border lines have been added below. See the image which is given below.

2K+ Views
