
Article Categories
- All Categories
-
 Data Structure
-
 Networking
-
 RDBMS
RDBMS
-
 Operating System
-
 Java
Java
-
 MS Excel
-
 iOS
iOS
-
 HTML
HTML
-
 CSS
CSS
-
 Android
-
 Python
-
 C Programming
-
 C++
C++
-
 C#
C#
-
 MongoDB
-
 MySQL
MySQL
-
 Javascript
-
 PHP
PHP
-
 Economics & Finance
How to add and remove error bars in Excel?
Error Bar is a versatile tool for displaying data variability and highlighting the gap between the reported value and the true value.
Add Error Bar in Excel
Let?s take an example to understand how error bars are added and removed in Excel.
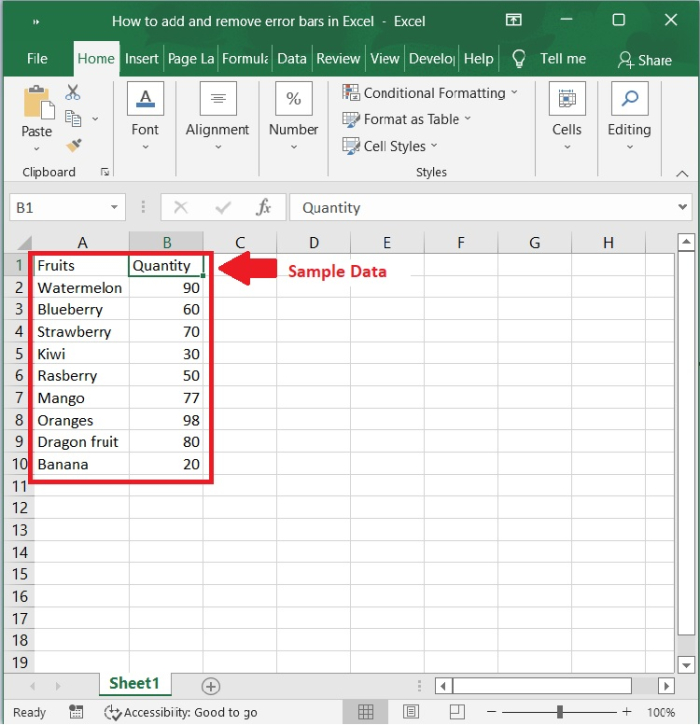
Step 1
At first, we must create a sample data for chart an excel sheet in columnar format, as shown in the following screenshot.
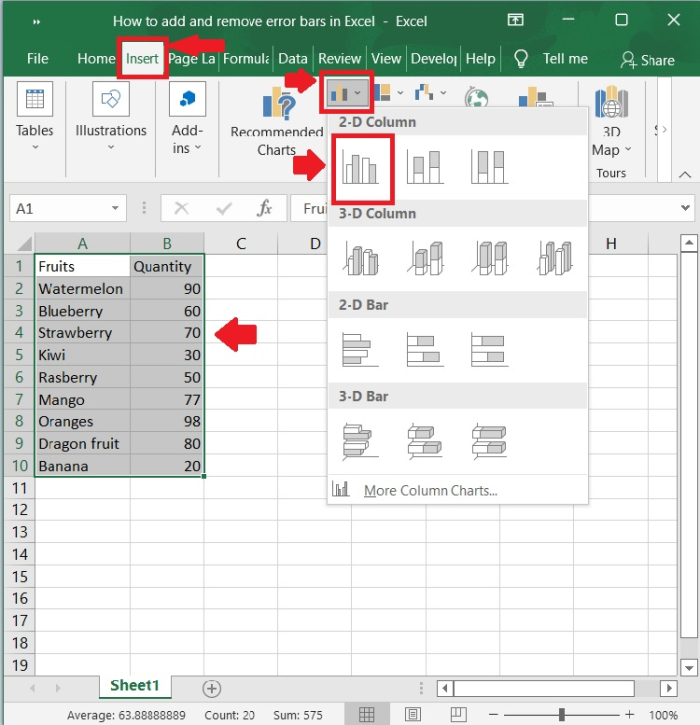
Step 2
Then, select the cells in the A1:B10 range. Click on Insert tool bar and select bar chart>2-D column to display the graph for the above sample data. Below is the screenshot for the same.
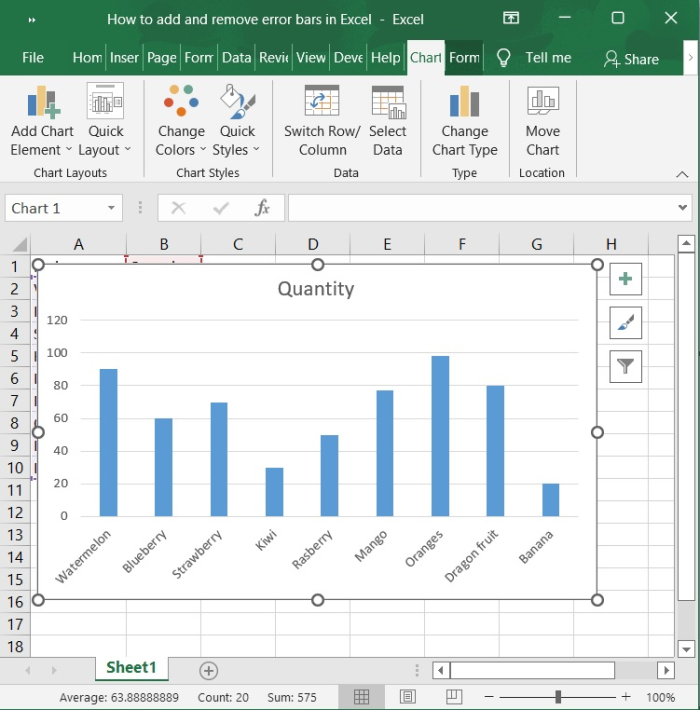
Step 3
Now, the chart is automatically populated upon selecting the above option. Refer the following screenshot.
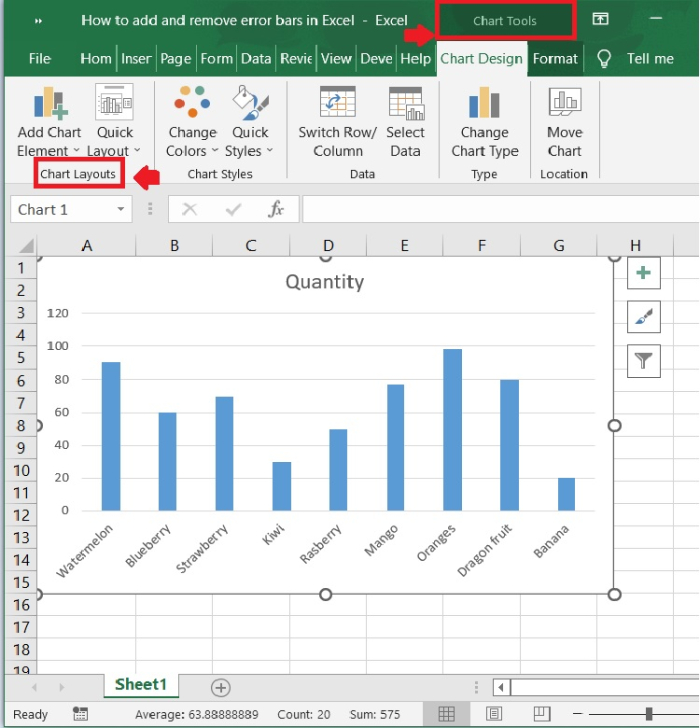
Step 4
When you click the chart to which you want to add an error bar, the Chart Tools in the Ribbon will be activated.
Step 5
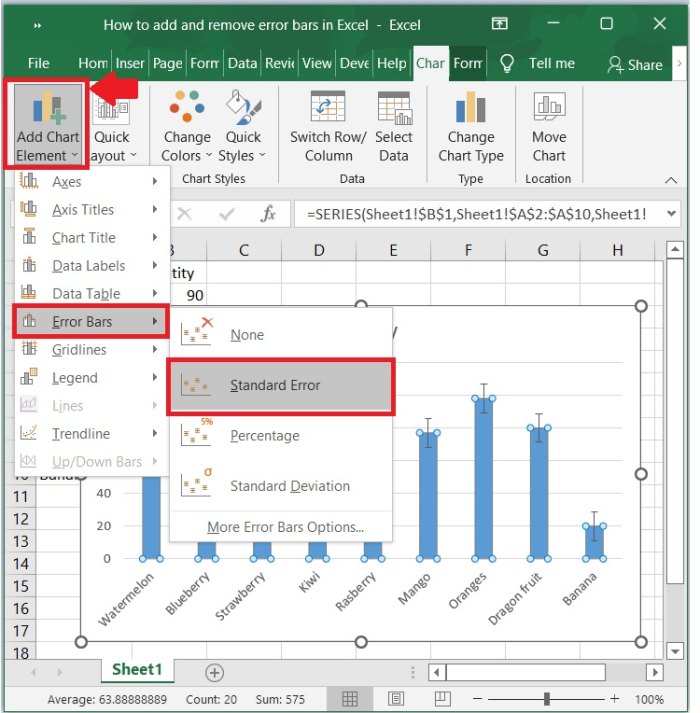
Now, click on Add Chart Elements and then select Error Bars option and choose Standard Error to enable the error bars.
Here,
Standard Error ? displays the mean standard error for all values, indicating how far the sample mean is likely to deviate from the population mean.
Percentage ? inserts error bars with the default value of 5%, but you can change this by selecting More Options.
Standard Deviation ? indicates the degree of variability in the data, i.e., how close it is to the mean. By default, all data points are graphed with one standard deviation.
More Options... enables you to select your own error bar amounts and create personalized error bars.
None ? it removes the error bars on chart.
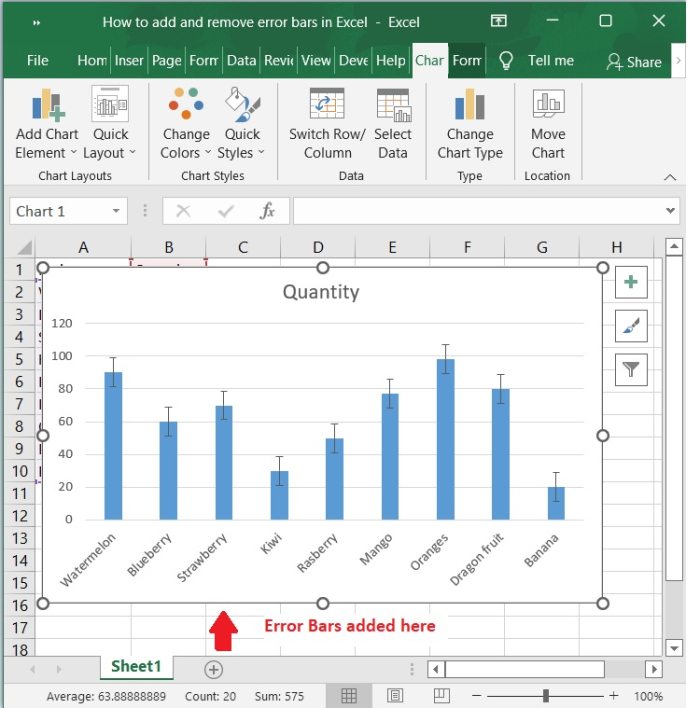
Step 6
Now, we can see the error bars are enable on the chart.
Remove Error Bars in Excel
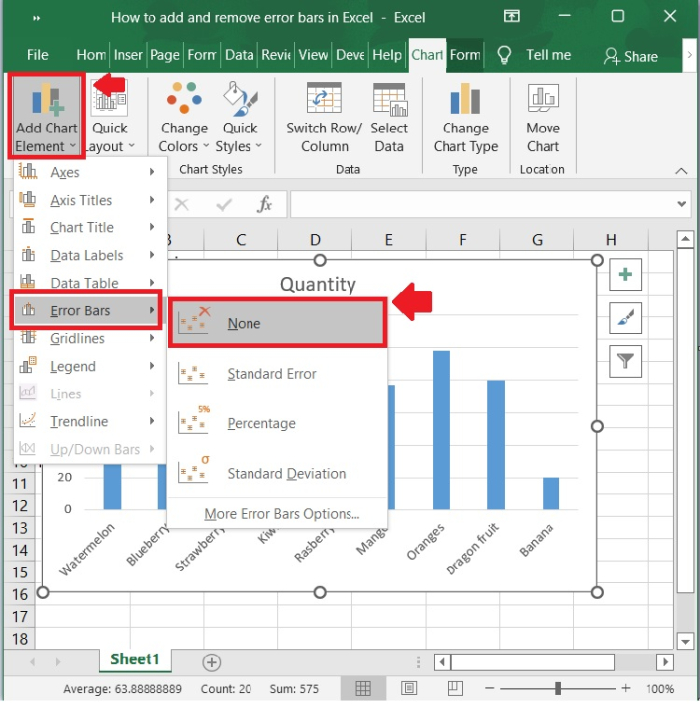
Step 7
Click Add Chart Elements and then select Error Bars option and choose None option to disable the error bars.
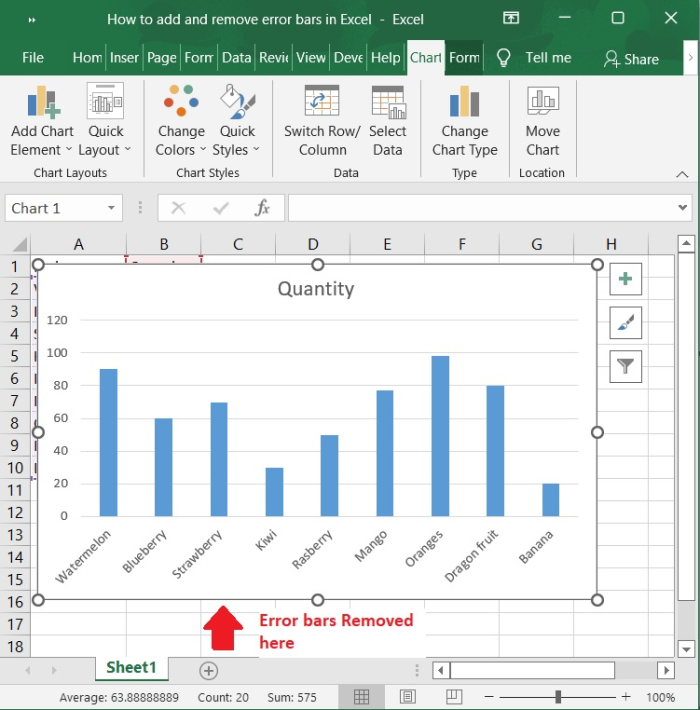
Step 8
Now, observe that the error bars are disabled on the chart.
Conclusion
In this tutorial, we explained how error bars are added and removed in Excel.

582 Views
