
Article Categories
- All Categories
-
 Data Structure
-
 Networking
-
 RDBMS
RDBMS
-
 Operating System
-
 Java
Java
-
 MS Excel
-
 iOS
iOS
-
 HTML
HTML
-
 CSS
CSS
-
 Android
-
 Python
-
 C Programming
-
 C++
C++
-
 C#
C#
-
 MongoDB
-
 MySQL
MySQL
-
 Javascript
-
 PHP
PHP
-
 Economics & Finance
Selected Reading
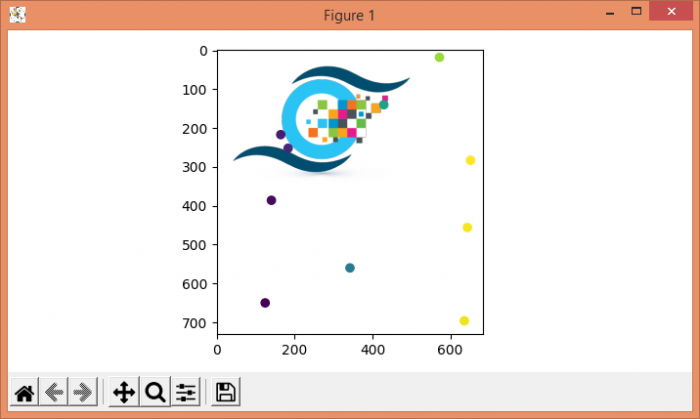
How do you directly overlay a scatter plot on top of a jpg image in Matplotlib?
To directly overlay a scatter plot on top of a jpg image, we can take the following steps −
Load an image "bird.jpg", using imread() method, Read an image from a file into an array.
Now display data as an image.
To plot scatter points on the image make lists for x_points and y_points.
Generate random numbers for x and y and append in lists.
Using scatter method, plot x and y points.
To display the figure, use show() method.
Example
import numpy as np
from matplotlib import pyplot as plt
plt.rcParams["figure.figsize"] = [7.00, 3.50]
plt.rcParams["figure.autolayout"] = True
data = plt.imread("logo2.jpg")
im = plt.imshow(data)
x_points = []
y_points = []
for i in range(10):
   x_points.append(np.random.randint(0, 700))
   y_points.append(np.random.randint(0, 700))
plt.scatter(x_points, y_points, c=x_points)
plt.show()
Output

Updated on: 2021-05-06T13:59:04+05:30
3K+ Views

Advertisements