
Article Categories
- All Categories
-
 Data Structure
-
 Networking
-
 RDBMS
RDBMS
-
 Operating System
-
 Java
Java
-
 MS Excel
-
 iOS
iOS
-
 HTML
HTML
-
 CSS
CSS
-
 Android
-
 Python
-
 C Programming
-
 C++
C++
-
 C#
C#
-
 MongoDB
-
 MySQL
MySQL
-
 Javascript
-
 PHP
PHP
-
 Economics & Finance
Selected Reading
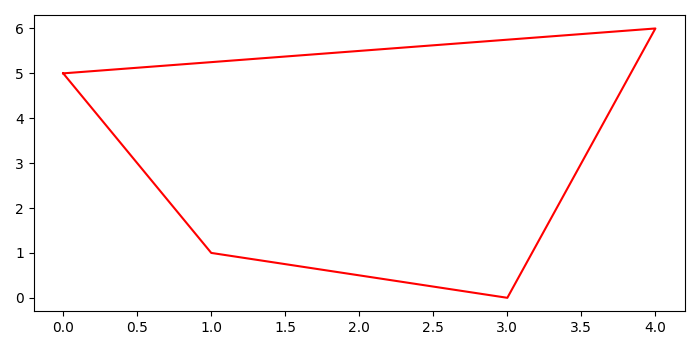
How do I plot Shapely polygons and objects using Matplotlib?
To plot shapely polygons and objects using matplotlib, the steps are as follows −
Create a polygon object using (x, y) data points.
Get x and y, the exterior data, and the array using polygon.exterior.xy.
Plot x and y data points using plot() method with red color.
Example
from shapely.geometry import Polygon
import matplotlib.pyplot as plt
plt.rcParams["figure.figsize"] = [7.00, 3.50]
plt.rcParams["figure.autolayout"] = True
polygon1 = Polygon([(0, 5),
   (1, 1),
   (3, 0),
   (4, 6),
])
x, y = polygon1.exterior.xy
plt.plot(x, y, c="red")
plt.show()
Output

Updated on: 2021-05-06T12:51:12+05:30
7K+ Views

Advertisements