
Article Categories
- All Categories
-
 Data Structure
-
 Networking
-
 RDBMS
RDBMS
-
 Operating System
-
 Java
Java
-
 MS Excel
-
 iOS
iOS
-
 HTML
HTML
-
 CSS
CSS
-
 Android
-
 Python
-
 C Programming
-
 C++
C++
-
 C#
C#
-
 MongoDB
-
 MySQL
MySQL
-
 Javascript
-
 PHP
PHP
-
 Economics & Finance
Selected Reading
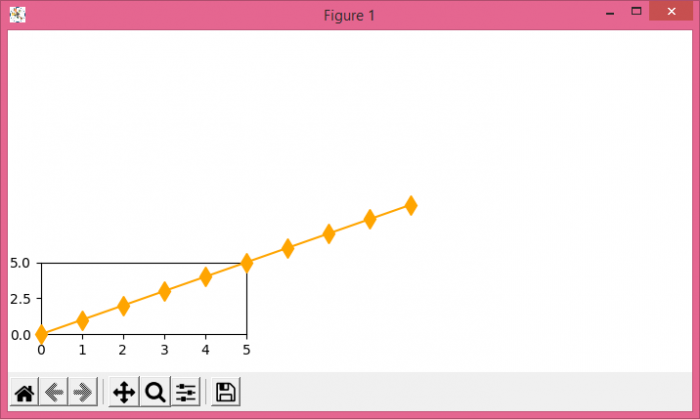
How do I let my Matplotlib plot go beyond the axes?
To let my matplotlib plot go beyond the axes, we can turn off the flag clip_on in the argument of plot() method.
Steps
Create xs and ys data points using numpy.
Limit the X and Y axis range in the plot to let the line go beyond this limit, using xlim() and ylim() method.
Plot the xs and ys data points using plot() method, where marker is a diamond shape, color is orange and clip_on=False (to go beyond the plot).
To display the figure, use show() method.
Example
import numpy as np
from matplotlib import pyplot as plt
plt.rcParams["figure.figsize"] = [7.00, 3.50]
plt.rcParams["figure.autolayout"] = True
xs = np.arange(10)
ys = np.arange(10)
plt.xlim(0, 5)
plt.ylim(0, 5)
plt.plot(xs, ys, marker='d', c='orange', markersize=10, clip_on=False, zorder=10)
plt.show()
Output

Updated on: 2021-05-08T09:11:13+05:30
2K+ Views

Advertisements