
Article Categories
- All Categories
-
 Data Structure
-
 Networking
-
 RDBMS
RDBMS
-
 Operating System
-
 Java
Java
-
 MS Excel
-
 iOS
iOS
-
 HTML
HTML
-
 CSS
CSS
-
 Android
-
 Python
-
 C Programming
-
 C++
C++
-
 C#
C#
-
 MongoDB
-
 MySQL
MySQL
-
 Javascript
-
 PHP
PHP
-
 Economics & Finance
Selected Reading
How do I get interactive plots again in Spyder/Ipython/matplotlib?
To get interactive plots, we need to activate the figure. Using plt.ioff() and plt.ion(), we can perform interactive actions with plot.
Steps
Create fig and ax variables using subplots method, where default nrows and ncols are 1.
Draw a line, using plot() method.
Set the color of the line, i.e., orange.
Stopped the interaction, using plt.ioff() method.
To make the interaction plots, change the color of the line coordinate.
Start the interaction, using plt.ion() method.
Example
To use interactive plot in Ipython -
In [1]: %matplotlib auto
Using matplotlib backend: GTK3Agg
In [2]: import matplotlib.pyplot as plt
In [3]: fig, ax = plt.subplots() # Diagram will get popped up, Let’s interact.
In [4]: ln, = ax.plot(range(5)) # Drawing a line
In [5]: ln.set_color('orange') # Changing drawn line to orange
In [6]: plt.ioff() # Stopped interaction
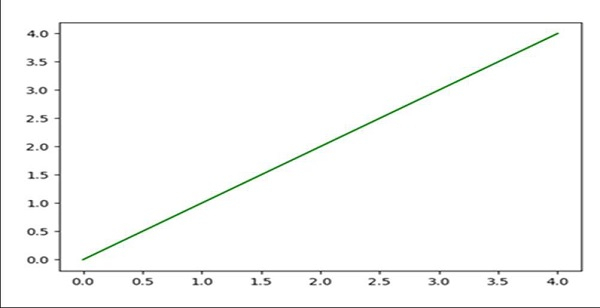
In [7]: ln.set_color('green')
# Since we have stopped the interaction in the last step
In [8]: plt.ion() # Started interaction
Output

Updated on: 2021-03-15T08:31:31+05:30
3K+ Views

Advertisements