
Article Categories
- All Categories
-
 Data Structure
-
 Networking
-
 RDBMS
RDBMS
-
 Operating System
-
 Java
Java
-
 MS Excel
-
 iOS
iOS
-
 HTML
HTML
-
 CSS
CSS
-
 Android
-
 Python
-
 C Programming
-
 C++
C++
-
 C#
C#
-
 MongoDB
-
 MySQL
MySQL
-
 Javascript
-
 PHP
PHP
-
 Economics & Finance
How do I format the axis number format to thousands with a comma in Matplotlib?
First, we can make two lists of x and y, where the values will be more than 1000. Then, we can use the ax.yaxis.set_major_formatter method where can pass StrMethodFormatter('{x:,}') method with {x:,} formatter that helps to separate out the 1000 figures from the given set of numbers.
Steps
Make two lists having numbers greater than 2000.
Create fig and ax variables using subplots method, where default nrows and ncols are 1, using subplot() method.
Plot line using x and y (from step 1).
Set the formatter of the major ticker, using ax.yaxis.set_major_formatter() method, where StrMethodFormatter helps to make 1000 with common, i.e., expression {x:,}. Use a new-style format string (as used by 'str.format') to format the tick.
Set the formatter of the major ticker, using ax.xaxis.set_major_formatter() method, where StrMethodFormatter helps to make 1000 with common, i.e., expression {x:,}. Use a new-style format string (as used by 'str.format') to format the tick.
To show the figure, use plt.show() method.
Example
import matplotlib.pyplot as plt
from matplotlib.ticker import FormatStrFormatter, StrMethodFormatter

x = [10110, 20110, 40110, 6700]

y = [20110, 10110, 30110, 9700]

fig, ax = plt.subplots()
ax.plot(x, y)
ax.yaxis.set_major_formatter(StrMethodFormatter('{x:,}'))
ax.xaxis.set_major_formatter(StrMethodFormatter('{x:,}'))

plt.show()
Output
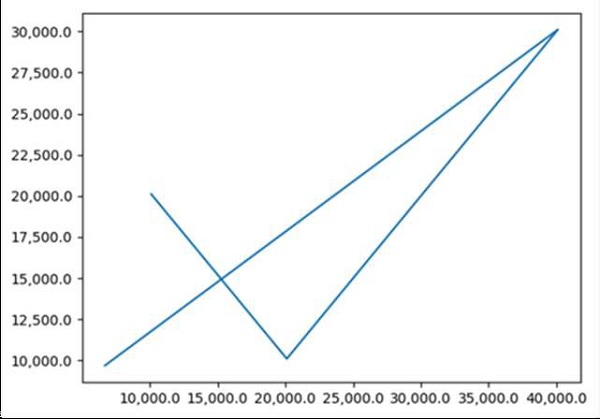

6K+ Views
