
Article Categories
- All Categories
-
 Data Structure
-
 Networking
-
 RDBMS
RDBMS
-
 Operating System
-
 Java
Java
-
 MS Excel
-
 iOS
iOS
-
 HTML
HTML
-
 CSS
CSS
-
 Android
-
 Python
-
 C Programming
-
 C++
C++
-
 C#
C#
-
 MongoDB
-
 MySQL
MySQL
-
 Javascript
-
 PHP
PHP
-
 Economics & Finance
Selected Reading
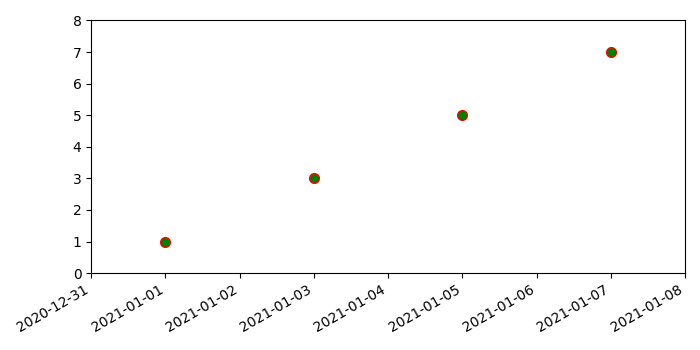
How do I change the range of the X-axis with datetimes in Matplotlib?
To change the range of the X-axis with datetimes in matplotlib, we can take the following steps −
Create a list of x and y, where x stores the datetime and y stores the number.
Using subplots method, create a figure and add a set of subplots.
Plot x and y data points using plots() method, wehere markerface color is green, marker edge color is red, and marker size is 7.
Since date ticklabels often overlap, so it is useful to rorate them and right-align them using autofmt_xdate() method.
To change the range of X-axis with datetimes, use set_xlim() with range of datetimes.
To change the range of Y-axis, use set_ylim() method.
To display the figure, use show() method.
Example
import datetime
import matplotlib.pyplot as plt
plt.rcParams["figure.figsize"] = [7.00, 3.50]
plt.rcParams["figure.autolayout"] = True
x = [datetime.date(2021, 1, 1), datetime.date(2021, 1, 3), datetime.date(2021, 1,
5), datetime.date(2021, 1, 7)]
y = [1, 3, 5, 7]
fig, ax = plt.subplots()
ax.plot_date(x, y, markerfacecolor='green', markeredgecolor='red', ms=7)
fig.autofmt_xdate()
ax.set_xlim([datetime.date(2020, 12, 31), datetime.date(2021, 1, 8)])
ax.set_ylim([0, 8])
plt.show()
Output

Updated on: 2021-05-06T13:35:17+05:30
10K+ Views

Advertisements