
Article Categories
- All Categories
-
 Data Structure
-
 Networking
-
 RDBMS
RDBMS
-
 Operating System
-
 Java
Java
-
 MS Excel
-
 iOS
iOS
-
 HTML
HTML
-
 CSS
CSS
-
 Android
-
 Python
-
 C Programming
-
 C++
C++
-
 C#
C#
-
 MongoDB
-
 MySQL
MySQL
-
 Javascript
-
 PHP
PHP
-
 Economics & Finance
How can Matplotlib be used to generate time-series data?
Matplotlib library is built upon Numpy. It is a Python library that is used to visualize data. It is a tree−like hierarchical structure which consists of objects that makeup each of these plots.
A ’Figure’ in Matplotlib can be understood as the outermost storage for a graph. This ‘Figure’ can contains multiple ‘Axes’ objects. ‘Axes’ object is NOT the plural form of ‘Axis’ in this case.
‘Axes’ can be understood as a part of ‘Figure’, a subplot. It can be used to manipulate every part of the graph inside it. A ‘Figure’ object in Matplotlib is a box that stores one or more ‘Axes’ objects. Under ‘Axes’ comes the tick marks, lines, legends, and text boxes in the hierarchy. Every object in the Matplotlib can be manipulated.
Time series, as the name suggests, is data that contains certain time periods or time stamps. It contains observations over certain time period. This kind of data tells us about how variables change over time based on various factors. Time series analysing and forecasting can be used to predict data with respect to some future time.
Time series, as the name suggests, is data that contains certain time periods or time stamps. It contains observations over certain time period. This kind of data tells us about how variables change over time based on various factors. Time series analysing and forecasting can be used to predict data with respect to some future time.
Following is an example −
Example
import pandas as pd
import matplotlib.pyplot as plt
from datetime import datetime
my_date = ['01−01−2018', '01−02−2018', '01−03−2018','01−04−2018',
'01−05−2018', '01−06−2018', '01−07−2018', '01−08−2018']
my_price= [1,2,3,4,5,6,7,8]
my_df = pd.DataFrame(my_date, my_price)
my_df['value'] = [67, 99, 88, 34, 101, 21, 56, 77]
my_df.columns = ['my_date', 'my_vals']
my_df['my_date'] = pd.to_datetime(my_df['my_date'])
my_df.index = my_df['my_date']
del my_df['my_date']

my_df.plot(figsize=(15, 6))
plt.show()
Output
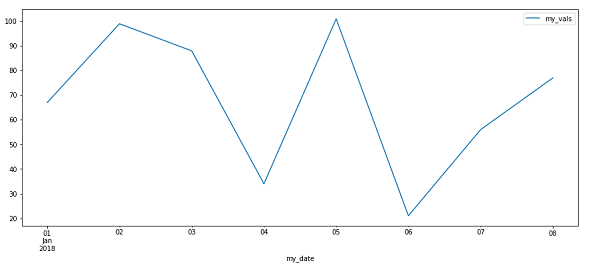
Explanation
The required packages are imported.
Data is generated and stored in a dataframe.
The ‘dates’ are converted to ‘datetime’ type.
The date column is stored as the index of the dataframe.
The plot is displayed on the console.

211 Views
