
Article Categories
- All Categories
-
 Data Structure
-
 Networking
-
 RDBMS
RDBMS
-
 Operating System
-
 Java
Java
-
 MS Excel
-
 iOS
iOS
-
 HTML
HTML
-
 CSS
CSS
-
 Android
-
 Python
-
 C Programming
-
 C++
C++
-
 C#
C#
-
 MongoDB
-
 MySQL
MySQL
-
 Javascript
-
 PHP
PHP
-
 Economics & Finance
Selected Reading
How can I rotate xtick labels through 90 degrees in Matplotlib?
To rotate xtick labels through 90 degrees, we can take the following steps −
Make a list (x) of numbers.
Add a subplot to the current figure.
Set ticks on X-axis.
Set xtick labels and use rotate=90 as the arguments in the method.
To display the figure, use show() method.
Example
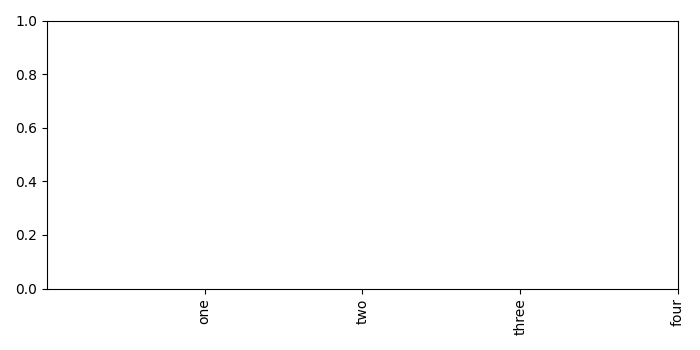
import matplotlib.pyplot as plt
plt.rcParams["figure.figsize"] = [7.00, 3.50]
plt.rcParams["figure.autolayout"] = True
x = [1, 2, 3, 4]
ax1 = plt.subplot()
ax1.set_xticks(x)
ax1.set_xticklabels(["one", "two", "three", "four"], rotation=90)
plt.show()
Output

Updated on: 2021-05-08T08:34:56+05:30
9K+ Views

Advertisements