- GWT Highcharts - Home
- GWT Highcharts - Overview
- Environment Setup
- Configuration Syntax
- GWT Highcharts - Line Charts
- GWT Highcharts - Area Charts
- GWT Highcharts - Bar Charts
- GWT Highcharts - Column Charts
- GWT Highcharts - Pie Charts
- GWT Highcharts - Scatter Chart
- GWT Highcharts - Dynamic Charts
- GWT Highcharts - Combinations
- GWT Highcharts - 3D Charts
- GWT Highcharts - Map Charts
- GWT Highcharts Useful Resources
- GWT Highcharts - Quick Guide
- GWT Highcharts - Useful Resources
- GWT Highcharts - Discussion
Selected Reading
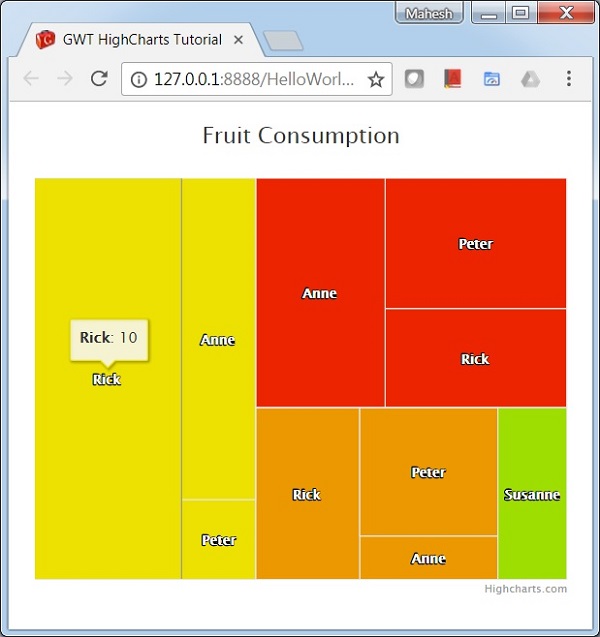
GWT Highcharts - Tree Map Chart
Following is an example of a Tree Map Chart.
We have already seen the configuration used to draw a chart in Highcharts Configuration Syntax chapter.
An example of a Tree Map Chart is given below.
Configurations
Let us now see the additional configurations/steps taken.
series
Configure the chart type to be 'treemap' based. series.type decides the series type for the chart. Here, the default value is "line".
series.setType(Type.TREEMAP);
Example
HelloWorld.java
package com.tutorialspoint.client;

import org.moxieapps.gwt.highcharts.client.Chart;
import org.moxieapps.gwt.highcharts.client.Point;
import org.moxieapps.gwt.highcharts.client.Series;

import com.google.gwt.core.client.EntryPoint;
import com.google.gwt.user.client.ui.RootPanel;

public class HelloWorld implements EntryPoint {
   public void onModuleLoad() {
      final Chart chart = new Chart()
         .setChartTitleText("Fruit Consumption");

      //Defining points to act as parents
      final Point  appleParent = new Point("Apples")
         .setColor("#EC2500");
      final Point bananaParent = new Point("Bananas")
         .setColor("#ECE100");
      final Point orangeParent = new Point("Oranges")
         .setColor("#EC9800");

      chart.addSeries(chart.createSeries()
         .setType(Series.Type.TREEMAP)
         .setPoints(new Point[]{
            appleParent,
            bananaParent,
            orangeParent,
            new Point("Anne", 5)
               .setParent(appleParent),
            new Point("Rick", 3)
               .setParent(appleParent),
            new Point("Peter", 4)
               .setParent(appleParent),
            new Point("Anne", 4)
               .setParent(bananaParent),
            new Point("Rick", 10)
               .setParent(bananaParent),
            new Point("Peter", 1)
               .setParent(bananaParent),
            new Point("Anne", 1)
               .setParent(orangeParent),
            new Point("Rick", 3)
               .setParent(orangeParent),
            new Point("Peter", 3)
               .setParent(orangeParent),
            new Point("Susanne", 2)
               .setParent("Kiwi")
               .setColor("#9EDE00")
         })
      );
      RootPanel.get().add(chart);
   }
}
Result
Verify the result.
gwt_highcharts_map_charts.htm

Advertisements