- GWT Highcharts - Home
- GWT Highcharts - Overview
- Environment Setup
- Configuration Syntax
- GWT Highcharts - Line Charts
- GWT Highcharts - Area Charts
- GWT Highcharts - Bar Charts
- GWT Highcharts - Column Charts
- GWT Highcharts - Pie Charts
- GWT Highcharts - Scatter Chart
- GWT Highcharts - Dynamic Charts
- GWT Highcharts - Combinations
- GWT Highcharts - 3D Charts
- GWT Highcharts - Map Charts
- GWT Highcharts Useful Resources
- GWT Highcharts - Quick Guide
- GWT Highcharts - Useful Resources
- GWT Highcharts - Discussion
Selected Reading
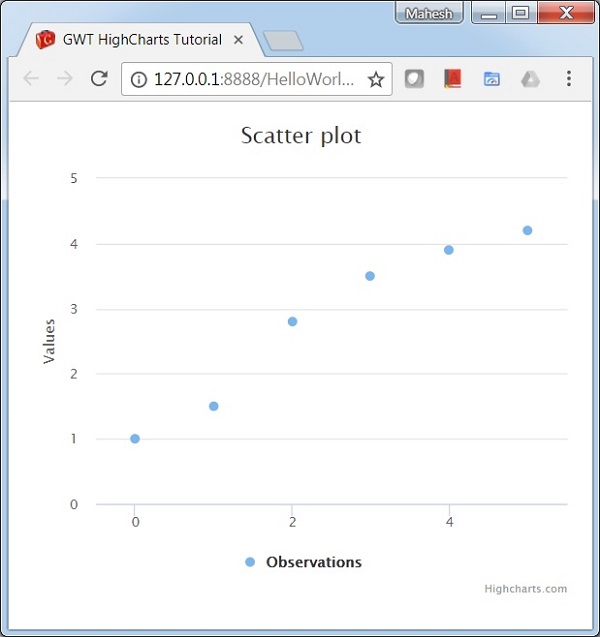
GWT Highcharts - Scatter Chart
Following is an example of a basic scatter chart.
We have already seen the configuration used to draw a chart in Highcharts Configuration Syntax chapter.
An example of a basic scatter chart is given below.
Configurations
Let us now see the additional configurations/steps taken.
series
Configure the chart type to be scatter based. series.type decides the series type for the chart. Here, the default value is "line".
chart.addSeries(chart.createSeries()
   .setName("Observations")
   .setType(Type.SCATTER)
   .setPoints(new Number[] {
      1, 1.5, 2.8, 3.5, 3.9, 4.2
   })
);
Example
HelloWorld.java
package com.tutorialspoint.client;

import org.moxieapps.gwt.highcharts.client.Chart;
import org.moxieapps.gwt.highcharts.client.Series.Type;

import com.google.gwt.core.client.EntryPoint;
import com.google.gwt.user.client.ui.RootPanel;

public class HelloWorld implements EntryPoint {
   public void onModuleLoad() {
      final Chart chart = new Chart()
         .setChartTitleText("Scatter plot");

      chart.getXAxis()
         .setMin(-0.5)
         .setMax(5.5);

      chart.getYAxis()
         .setMin(0);

      chart.addSeries(chart.createSeries()
         .setName("Observations")
         .setType(Type.SCATTER)
         .setPoints(new Number[] {
            1, 1.5, 2.8, 3.5, 3.9, 4.2
         })
      );
      RootPanel.get().add(chart);
   }
}
Result
Verify the result.

Advertisements