- GWT Highcharts - Home
- GWT Highcharts - Overview
- Environment Setup
- Configuration Syntax
- GWT Highcharts - Line Charts
- GWT Highcharts - Area Charts
- GWT Highcharts - Bar Charts
- GWT Highcharts - Column Charts
- GWT Highcharts - Pie Charts
- GWT Highcharts - Scatter Chart
- GWT Highcharts - Dynamic Charts
- GWT Highcharts - Combinations
- GWT Highcharts - 3D Charts
- GWT Highcharts - Map Charts
- GWT Highcharts Useful Resources
- GWT Highcharts - Quick Guide
- GWT Highcharts - Useful Resources
- GWT Highcharts - Discussion
GWT Highcharts - Configuration Syntax
In this chapter, we will showcase the configuration required to draw a chart using the Highcharts API in GWT.
Step 1: Create GWT Application
Follow the following steps to update the GWT application we created in GWT - Create Application chapter −
| Step | Description |
|---|---|
| 1 | Create a project with a name HelloWorld under a package com.tutorialspoint as explained in the GWT - Create Application chapter. |
| 2 | Modify HelloWorld.gwt.xml, HelloWorld.html and HelloWorld.java as explained below. Keep rest of the files unchanged. |
| 3 | Compile and run the application to verify the result of the implemented logic. |
Following is the content of the modified module descriptor src/com.tutorialspoint/HelloWorld.gwt.xml.
<?xml version = "1.0" encoding = "UTF-8"?>
<module rename-to = 'helloworld'>
   <inherits name = 'com.google.gwt.user.User'/>
   <inherits name = 'com.google.gwt.user.theme.clean.Clean'/>
   <entry-point class = 'com.tutorialspoint.client.HelloWorld'/>
   <inherits name="org.moxieapps.gwt.highcharts.Highcharts"/>
   <source path = 'client'/>
   <source path = 'shared'/>
</module>
Following is the content of the modified HTML host file war/HelloWorld.html.
<html>
   <head>
      <title>GWT Highcharts Showcase</title>
      <link rel = "stylesheet" href = "HelloWorld.css"/>
      <script language = "javascript" src = "helloworld/helloworld.nocache.js">
         <script src = "https://ajax.googleapis.com/ajax/libs/jquery/2.1.3/jquery.min.js" />
         <script src = "https://code.highcharts.com/highcharts.js" />
      </script>
   </head>
   <body>
   </body>
</html>
We'll see the updated HelloWorld.java in the end after understanding configurations.
Step 2: Create Configurations
Create Chart
Configure the type, title and sub-title of the chart.
Chart chart = new Chart()
.setType(Type.SPLINE)
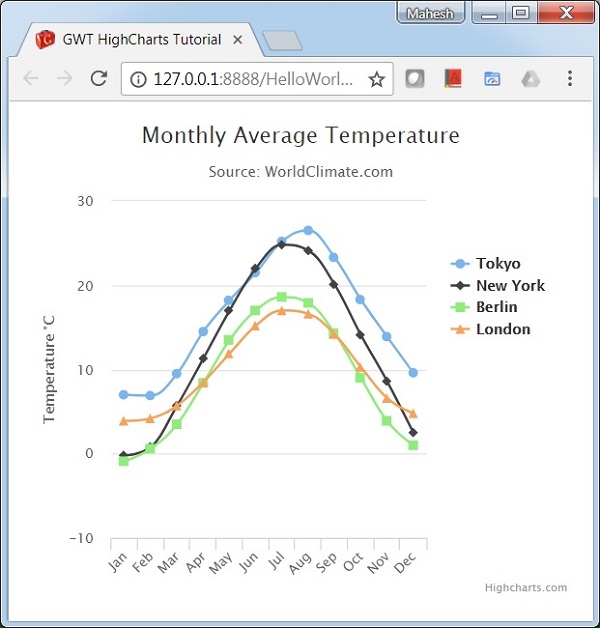
.setChartTitleText("Monthly Average Temperature")
.setChartSubtitleText("Source: WorldClimate.com");
xAxis
Configure the ticker to be displayed on the X-Axis.
XAxis xAxis = chart.getXAxis();
xAxis.setCategories("Jan", "Feb", "Mar", "Apr", "May", "Jun",
   "Jul", "Aug", "Sep", "Oct", "Nov", "Dec");
yAxis
Configure the title, plot lines to be displayed on the Y-Axis.
YAxis yAxis = chart.getYAxis();
yAxis.setAxisTitleText("Temperature C");
yAxis.createPlotLine()
   .setValue(0)
   .setWidth(1)
   .setColor("#808080");
tooltip
Configure the tooltip. Put suffix to be added after value (y-axis).
ToolTip toolTip = new ToolTip();
toolTip.setValueSuffix("C");
chart.setToolTip(toolTip);
legend
Configure the legend to be displayed on the right side of the chart along with other properties.
legend.setLayout(Legend.Layout.VERTICAL)
   .setAlign(Legend.Align.RIGHT)
   .setVerticalAlign(Legend.VerticalAlign.TOP)
   .setX(-10)
   .setY(100)
   .setBorderWidth(0);
chart.setLegend(legend);
series
Configure the data to be displayed on the chart. Series is an array where each element of this array represents a single line on the chart.
chart.addSeries(chart.createSeries()
   .setName("Tokyo")
   .setPoints(new Number[] {
      7.0, 6.9, 9.5, 14.5, 18.2, 21.5, 25.2,
      26.5, 23.3, 18.3, 13.9, 9.6
   })
);

chart.addSeries(chart.createSeries()
   .setName("New York")
   .setPoints(new Number[] {
      -0.2, 0.8, 5.7, 11.3, 17.0, 22.0, 24.8,
      24.1, 20.1, 14.1, 8.6, 2.5
   })
);

chart.addSeries(chart.createSeries()
   .setName("Berlin")
   .setPoints(new Number[] {
      -0.9, 0.6, 3.5, 8.4, 13.5, 17.0, 18.6,
      17.9, 14.3, 9.0, 3.9, 1.0
   })
);

chart.addSeries(chart.createSeries()
   .setName("London")
   .setPoints(new Number[] {
      3.9, 4.2, 5.7, 8.5, 11.9, 15.2, 17.0,
      16.6, 14.2, 10.3, 6.6, 4.8
   })
);
Step 3: Add the chart to parent panel.
We're adding the chart to root panel.
RootPanel.get().add(chart);
Example
Consider the following example to further understand the Configuration Syntax −
HelloWorld.java
package com.tutorialspoint.client;

import org.moxieapps.gwt.highcharts.client.Chart;
import org.moxieapps.gwt.highcharts.client.Legend;
import org.moxieapps.gwt.highcharts.client.Series.Type;
import org.moxieapps.gwt.highcharts.client.ToolTip;
import org.moxieapps.gwt.highcharts.client.XAxis;
import org.moxieapps.gwt.highcharts.client.YAxis;

import com.google.gwt.core.client.EntryPoint;
import com.google.gwt.user.client.ui.RootPanel;

public class HelloWorld implements EntryPoint {
   public void onModuleLoad() {
      Chart chart = new Chart()
         .setType(Type.SPLINE)
         .setChartTitleText("Monthly Average Temperature")
         .setChartSubtitleText("Source: WorldClimate.com");

      XAxis xAxis = chart.getXAxis();
      xAxis.setCategories("Jan", "Feb", "Mar", "Apr", "May", "Jun",
         "Jul", "Aug", "Sep", "Oct", "Nov", "Dec");

      YAxis yAxis = chart.getYAxis();
      yAxis.setAxisTitleText("Temperature C");
      yAxis.createPlotLine()
         .setValue(0)
         .setWidth(1)
         .setColor("#808080");

      ToolTip toolTip = new ToolTip();
      toolTip.setValueSuffix("C");
      chart.setToolTip(toolTip);

      Legend legend = new Legend();
      legend.setLayout(Legend.Layout.VERTICAL)
         .setAlign(Legend.Align.RIGHT)
         .setVerticalAlign(Legend.VerticalAlign.TOP)
         .setX(-10)
         .setY(100)
         .setBorderWidth(0);
      chart.setLegend(legend);

      chart.addSeries(chart.createSeries()
         .setName("Tokyo")
         .setPoints(new Number[] {
            7.0, 6.9, 9.5, 14.5, 18.2, 21.5, 25.2,
            26.5, 23.3, 18.3, 13.9, 9.6
         })
      );

      chart.addSeries(chart.createSeries()
         .setName("New York")
         .setPoints(new Number[] {
            -0.2, 0.8, 5.7, 11.3, 17.0, 22.0, 24.8,
            24.1, 20.1, 14.1, 8.6, 2.5
         })
      );

      chart.addSeries(chart.createSeries()
         .setName("Berlin")
         .setPoints(new Number[] {
            -0.9, 0.6, 3.5, 8.4, 13.5, 17.0, 18.6,
            17.9, 14.3, 9.0, 3.9, 1.0
         })
      );

      chart.addSeries(chart.createSeries()
         .setName("London")
         .setPoints(new Number[] {
            3.9, 4.2, 5.7, 8.5, 11.9, 15.2, 17.0,
            16.6, 14.2, 10.3, 6.6, 4.8
         })
      );
      RootPanel.get().add(chart);
   }
}
Result
Verify the result.