- GWT Highcharts - Home
- GWT Highcharts - Overview
- Environment Setup
- Configuration Syntax
- GWT Highcharts - Line Charts
- GWT Highcharts - Area Charts
- GWT Highcharts - Bar Charts
- GWT Highcharts - Column Charts
- GWT Highcharts - Pie Charts
- GWT Highcharts - Scatter Chart
- GWT Highcharts - Dynamic Charts
- GWT Highcharts - Combinations
- GWT Highcharts - 3D Charts
- GWT Highcharts - Map Charts
- GWT Highcharts Useful Resources
- GWT Highcharts - Quick Guide
- GWT Highcharts - Useful Resources
- GWT Highcharts - Discussion
Selected Reading
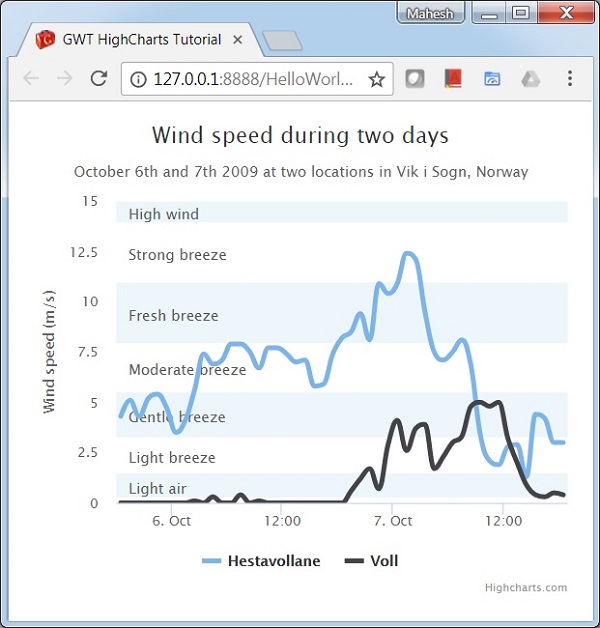
Spline chart with Plot Bands
Following is an example of a spline chart with plot bands.
We have already seen the configuration used to draw a chart in Highcharts Configuration Syntax chapter. Now, let us understand an example of a spline chart with plot bands where additional configurations/steps are taken.
Configurations
Configure the bands using the yAxis.plotBands property. Set the band range using the 'from' and 'to' property. Set the color of band using the 'color' property. Style the label of band using the 'label' property.
yAxis
yAxis.setAxisTitleText("Wind speed (m/s)")
   .setMin(0)
   .setMinorGridLineWidth(0)
   .setGridLineWidth(0)
   .setAlternateGridColor(null)
   .setPlotBands(
      yAxis.createPlotBand()   // Light air
         .setFrom(0.3)
         .setTo(1.5)
         .setColor(blueColor)
         .setLabel(new PlotBandLabel()
            .setText("Light air")
            .setStyle(new Style()
               .setColor("#606060")
            )
         ),
      yAxis.createPlotBand()   // Light breeze
         .setFrom(1.5)
         .setTo(3.3)
         .setColor(clearColor)
         .setLabel(new PlotBandLabel()
            .setText("Light breeze")
            .setStyle(new Style()
               .setColor("#606060")
            )
         )
   );
Example
HelloWorld.java
package com.tutorialspoint.client;

import java.util.Date;

import org.moxieapps.gwt.highcharts.client.Chart;
import org.moxieapps.gwt.highcharts.client.Color;
import org.moxieapps.gwt.highcharts.client.Point;
import org.moxieapps.gwt.highcharts.client.Series.Type;
import org.moxieapps.gwt.highcharts.client.Style;
import org.moxieapps.gwt.highcharts.client.ToolTip;
import org.moxieapps.gwt.highcharts.client.ToolTipData;
import org.moxieapps.gwt.highcharts.client.ToolTipFormatter;
import org.moxieapps.gwt.highcharts.client.XAxis;

import org.moxieapps.gwt.highcharts.client.YAxis;
import org.moxieapps.gwt.highcharts.client.labels.AxisLabelsData;
import org.moxieapps.gwt.highcharts.client.labels.AxisLabelsFormatter;
import org.moxieapps.gwt.highcharts.client.labels.PlotBandLabel;
import org.moxieapps.gwt.highcharts.client.labels.YAxisLabels;

import org.moxieapps.gwt.highcharts.client.plotOptions.Marker;
import org.moxieapps.gwt.highcharts.client.plotOptions.SplinePlotOptions;
import org.moxieapps.gwt.highcharts.client.Axis;


import com.google.gwt.core.client.EntryPoint;
import com.google.gwt.i18n.client.DateTimeFormat;
import com.google.gwt.user.client.ui.RootPanel;

public class HelloWorld implements EntryPoint {
   public void onModuleLoad() {
      Chart chart = new Chart()
         .setType(Type.SPLINE)
         .setChartTitleText("Wind speed during two days")
         .setChartSubtitleText("October 6th and 7th 2009 at two locations in Vik i Sogn, Norway");

         XAxis xAxis = chart.getXAxis().setType(Axis.Type.DATE_TIME);

         YAxis yAxis = chart.getYAxis();
         final Color blueColor = new Color(68, 170, 213, 0.1);
         final Color clearColor = new Color(0, 0, 0, 0);
         yAxis.setAxisTitleText("Wind speed (m/s)")
            .setMin(0)
            .setMinorGridLineWidth(0)
            .setGridLineWidth(0)
            .setAlternateGridColor(null)
            .setPlotBands(
               yAxis.createPlotBand()   // Light air
                  .setFrom(0.3)
                  .setTo(1.5)
                  .setColor(blueColor)
                  .setLabel(new PlotBandLabel()
                     .setText("Light air")
                     .setStyle(new Style()
                        .setColor("#606060")
                     )
                  ),
               yAxis.createPlotBand()   // Light breeze
                  .setFrom(1.5)
                  .setTo(3.3)
                  .setColor(clearColor)
                  .setLabel(new PlotBandLabel()
                     .setText("Light breeze")
                     .setStyle(new Style()
                        .setColor("#606060")
                     )
                  ),
               yAxis.createPlotBand()   // Gentle breeze
                  .setFrom(3.3)
                  .setTo(5.5)
                  .setColor(blueColor)
                  .setLabel(new PlotBandLabel()
                     .setText("Gentle breeze")
                     .setStyle(new Style()
                        .setColor("#606060")
                     )
                  ),
               yAxis.createPlotBand()   // Moderate breeze
                  .setFrom(5.5)
                  .setTo(8)
                  .setColor(clearColor)
                  .setLabel(new PlotBandLabel()
                     .setText("Moderate breeze")
                     .setStyle(new Style()
                        .setColor("#606060")
                     )
                  ),
               yAxis.createPlotBand()   // Fresh breeze
                  .setFrom(8)
                  .setTo(11)
                  .setColor(blueColor)
                  .setLabel(new PlotBandLabel()
                     .setText("Fresh breeze")
                     .setStyle(new Style()
                        .setColor("#606060")
                     )
                  ),
               yAxis.createPlotBand()   // Strong breeze
                  .setFrom(11)
                  .setTo(14)
                  .setColor(clearColor)
                  .setLabel(new PlotBandLabel()
                     .setText("Strong breeze")
                     .setStyle(new Style()
                        .setColor("#606060")
                     )
                  ),
               yAxis.createPlotBand()   // High wind
                  .setFrom(14)
                  .setTo(15)
                  .setColor(blueColor)
                  .setLabel(new PlotBandLabel()
                     .setText("High wind")
                     .setStyle(new Style()
                        .setColor("#606060")
                     )
                  )
            );
         ToolTip toolTip = new ToolTip();
         toolTip.setFormatter(new ToolTipFormatter() {
            @Override
            public String format(ToolTipData toolTipData) {
               return DateTimeFormat.getFormat("d. MMMM YYYY HH:00").format(
                  new Date(toolTipData.getXAsLong())
                  ) + ": " + toolTipData.getYAsDouble() + " m/s";
            }
         });

         chart.setToolTip(toolTip);

         chart.setSplinePlotOptions(new SplinePlotOptions()
            .setLineWidth(4)
            .setHoverStateLineWidth(5)
            .setMarker(new Marker()
               .setEnabled(false)
               .setHoverState(new Marker()
                  .setEnabled(true)
                  .setSymbol(Marker.Symbol.CIRCLE)
                  .setRadius(5)
                  .setLineWidth(1)
               )
            )
            .setPointInterval(3600000)  // one hour
            .setPointStart(
               DateTimeFormat.getFormat("yyyy-MM-dd").parse("2009-10-06").getTime()
            )
         );

         chart.addSeries(chart.createSeries()
            .setName("Hestavollane")
            .setPoints(new Number[]{
               4.3, 5.1, 4.3, 5.2, 5.4, 4.7, 3.5, 4.1, 5.6, 7.4, 6.9, 7.1,
               7.9, 7.9, 7.5, 6.7, 7.7, 7.7, 7.4, 7.0, 7.1, 5.8, 5.9, 7.4,
               8.2, 8.5, 9.4, 8.1, 10.9, 10.4, 10.9, 12.4, 12.1, 9.5, 7.5,
               7.1, 7.5, 8.1, 6.8, 3.4, 2.1, 1.9, 2.8, 2.9, 1.3, 4.4, 4.2,
               3.0, 3.0
            })
         );
         chart.addSeries(chart.createSeries()
            .setName("Voll")
            .setPoints(new Number[] {
               0.0, 0.0, 0.0, 0.0, 0.0, 0.0, 0.0, 0.0, 0.1, 0.0, 0.3, 0.0,
               0.0, 0.4, 0.0, 0.1, 0.0, 0.0, 0.0, 0.0, 0.0, 0.0, 0.0, 0.0,
               0.0, 0.6, 1.2, 1.7, 0.7, 2.9, 4.1, 2.6, 3.7, 3.9, 1.7, 2.3,
               3.0, 3.3, 4.8, 5.0, 4.8, 5.0, 3.2, 2.0, 0.9, 0.4, 0.3, 0.5, 0.4
            })
         );
      RootPanel.get().add(chart);
   }
}
Result
Verify the result.
gwt_highcharts_line_charts.htm

Advertisements