- GWT Highcharts - Home
- GWT Highcharts - Overview
- Environment Setup
- Configuration Syntax
- GWT Highcharts - Line Charts
- GWT Highcharts - Area Charts
- GWT Highcharts - Bar Charts
- GWT Highcharts - Column Charts
- GWT Highcharts - Pie Charts
- GWT Highcharts - Scatter Chart
- GWT Highcharts - Dynamic Charts
- GWT Highcharts - Combinations
- GWT Highcharts - 3D Charts
- GWT Highcharts - Map Charts
- GWT Highcharts Useful Resources
- GWT Highcharts - Quick Guide
- GWT Highcharts - Useful Resources
- GWT Highcharts - Discussion
Selected Reading
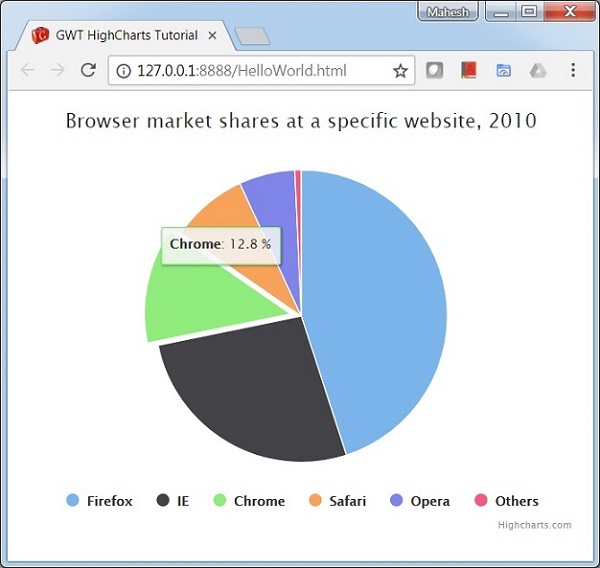
GWT Highcharts - Pie Chart with Legends
Following is an example of a Pie Chart with Legends.
We have already seen the configurations used to draw a chart in Highcharts Configuration Syntax chapter.
An example of a Pie Chart with Legends is given below.
Configurations
Let us now see the additional configurations/steps taken.
chart
Configure the chart type to be 'pie' based. chart.type decides the series type for the chart. Here, the default value is "line".
chart.setType(Type.PIE);
plotOptions
Configure the plotOptions to have legends in pie chart using plotOptions.pie.showInLegend attribute.
chart.setPiePlotOptions(new PiePlotOptions()
   .setAllowPointSelect(true)
   .setCursor(Cursor.POINTER)
   .setPieDataLabels(new PieDataLabels()
      .setEnabled(false)
   )
   .setShowInLegend(true)
)
Example
HelloWorld.java
package com.tutorialspoint.client;

import org.moxieapps.gwt.highcharts.client.Chart;
import org.moxieapps.gwt.highcharts.client.Legend;
import org.moxieapps.gwt.highcharts.client.Point;
import org.moxieapps.gwt.highcharts.client.Series.Type;
import org.moxieapps.gwt.highcharts.client.Style;

import org.moxieapps.gwt.highcharts.client.ToolTip;
import org.moxieapps.gwt.highcharts.client.ToolTipData;
import org.moxieapps.gwt.highcharts.client.ToolTipFormatter;

import org.moxieapps.gwt.highcharts.client.labels.DataLabels;
import org.moxieapps.gwt.highcharts.client.labels.DataLabelsData;
import org.moxieapps.gwt.highcharts.client.labels.DataLabelsFormatter;
import org.moxieapps.gwt.highcharts.client.labels.PieDataLabels;
import org.moxieapps.gwt.highcharts.client.labels.Labels.Align;
import org.moxieapps.gwt.highcharts.client.labels.XAxisLabels;

import org.moxieapps.gwt.highcharts.client.plotOptions.ColumnRangePlotOptions;
import org.moxieapps.gwt.highcharts.client.plotOptions.PiePlotOptions;
import org.moxieapps.gwt.highcharts.client.plotOptions.PlotOptions.Cursor;

import com.google.gwt.core.client.EntryPoint;
import com.google.gwt.i18n.client.NumberFormat;
import com.google.gwt.user.client.ui.RootPanel;

public class HelloWorld implements EntryPoint {
   public void onModuleLoad() {
      final Chart chart = new Chart()
         .setType(Type.PIE)
         .setChartTitleText("Browser market shares at a specific website, 2010")
         .setPlotBackgroundColor((String)null)
         .setPlotBorderWidth(null)
         .setPlotShadow(false)
         .setPiePlotOptions(new PiePlotOptions()
            .setAllowPointSelect(true)
            .setCursor(Cursor.POINTER)
            .setPieDataLabels(new PieDataLabels()
               .setEnabled(false)
            )
            .setShowInLegend(true)
         )
         .setToolTip(new ToolTip()
            .setFormatter(new ToolTipFormatter() {
               @Override
               public String format(ToolTipData toolTipData) {
                  return "<b>" + toolTipData.getPointName() + "</b>: " + toolTipData.getYAsDouble() + " %";
               }
            })
         );

         chart.addSeries(chart.createSeries()
            .setName("Browser share")
            .setPoints(new Point[]{
               new Point("Firefox", 45.0),
               new Point("IE", 26.8),
               new Point("Chrome", 12.8)
                  .setSliced(true)
                  .setSelected(true),
               new Point("Safari", 8.5),
               new Point("Opera", 6.2),
               new Point("Others", 0.7)
            })
         );
      RootPanel.get().add(chart);
   }
}
Result
Verify the result.
gwt_highcharts_pie_charts.htm

Advertisements