- GWT Highcharts - Home
- GWT Highcharts - Overview
- Environment Setup
- Configuration Syntax
- GWT Highcharts - Line Charts
- GWT Highcharts - Area Charts
- GWT Highcharts - Bar Charts
- GWT Highcharts - Column Charts
- GWT Highcharts - Pie Charts
- GWT Highcharts - Scatter Chart
- GWT Highcharts - Dynamic Charts
- GWT Highcharts - Combinations
- GWT Highcharts - 3D Charts
- GWT Highcharts - Map Charts
- GWT Highcharts Useful Resources
- GWT Highcharts - Quick Guide
- GWT Highcharts - Useful Resources
- GWT Highcharts - Discussion
Selected Reading
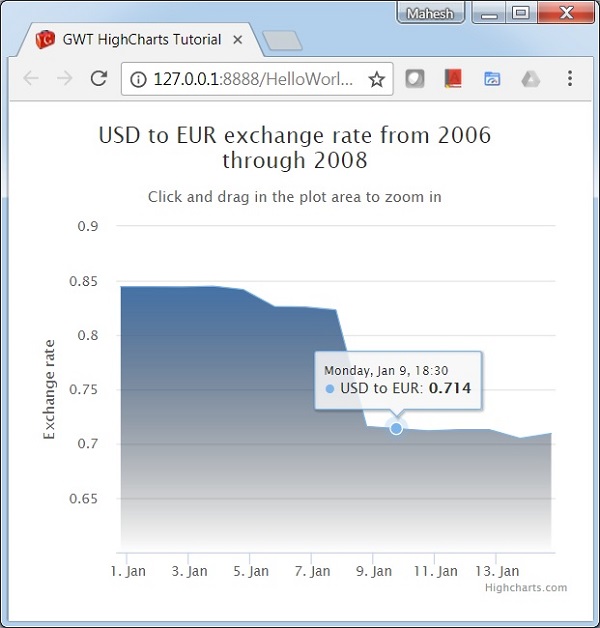
Time Series, Zoomable Chart
We have already seen the configuration used to draw this chart in Highcharts Configuration Syntax chapter. Let us now consider the following example to further understand a Time Series, Zoomable Chart.
Configurations
Let us now discuss the additional configurations/steps taken.
chart
Configure the chart to make it zoomable. chart.zoomType decides the dimensions by which the user can zoom by dragging the mouse. The possible values for this are x, y or xy.
chart.setZoomType(BaseChart.ZoomType.X)
plotOptions
Configure the area of chart using plotOptions.
chart.setAreaPlotOptions(new AreaPlotOptions()
   .setFillColor(new Color()
     .setLinearGradient(0, 0, 0, 1)
     .addColorStop(0, 69, 114, 167)
     .addColorStop(1, 2, 0, 0, 0)
   )
   .setMarker(new Marker()
      .setEnabled(false)
      .setHoverState(new Marker()
         .setEnabled(true)
         .setRadius(5)
      )
   )
   .setShadow(false)
   .setHoverStateLineWidth(1)
);
Example
HelloWorld.java
package com.tutorialspoint.client;

import org.moxieapps.gwt.highcharts.client.Axis;
import org.moxieapps.gwt.highcharts.client.BaseChart;
import org.moxieapps.gwt.highcharts.client.Chart;
import org.moxieapps.gwt.highcharts.client.Color;
import org.moxieapps.gwt.highcharts.client.Legend;
import org.moxieapps.gwt.highcharts.client.Series;
import org.moxieapps.gwt.highcharts.client.ToolTip;
import org.moxieapps.gwt.highcharts.client.plotOptions.AreaPlotOptions;
import org.moxieapps.gwt.highcharts.client.plotOptions.Marker;

import com.google.gwt.core.client.EntryPoint;
import com.google.gwt.i18n.client.DateTimeFormat;
import com.google.gwt.user.client.ui.RootPanel;

public class HelloWorld implements EntryPoint {
   public void onModuleLoad() {
      Chart chart = new Chart()
         .setZoomType(BaseChart.ZoomType.X)
         .setSpacingRight(20)
         .setChartTitleText("USD to EUR exchange rate from 2006 through 2008")
         .setChartSubtitleText("Click and drag in the plot area to zoom in")
         .setLegend(new Legend()
            .setEnabled(false))
         .setToolTip(new ToolTip()
            .setShared(true)
         )
         .setLegend(new Legend()
            .setEnabled(false)
         )
         .setAreaPlotOptions(new AreaPlotOptions()
            .setFillColor(new Color()
               .setLinearGradient(0, 0, 0, 1)
               .addColorStop(0, 69, 114, 167)
               .addColorStop(1, 2, 0, 0, 0)
            )
         .setMarker(new Marker()
            .setEnabled(false)
            .setHoverState(new Marker()
               .setEnabled(true)
               .setRadius(5)
            )
         )
         .setShadow(false)
            .setHoverStateLineWidth(1)
         );

      chart.getXAxis()
         .setType(Axis.Type.DATE_TIME)
         .setMaxZoom(14 * 24 * 3600000) //fourteen days
         .setAxisTitleText(null);

      chart.getYAxis()
         .setAxisTitleText("Exchange rate")
         .setMin(0.6)
         .setStartOnTick(false)
         .setShowFirstLabel(false);

      chart.addSeries(chart.createSeries()
         .setType(Series.Type.AREA)
         .setName("USD to EUR")
         .setPlotOptions(new AreaPlotOptions()
            .setPointInterval(24 * 3600 * 1000)
            .setPointStart(getTime("2006-01-01"))
         )
         .setPoints(new Number[] {
            0.8446, 0.8445, 0.8444, 0.8451, 0.8418, 0.8264, 0.8258, 0.8232,
            0.7158, 0.714,  0.7119, 0.7129, 0.7129, 0.7049, 0.7095
         })
      );
      RootPanel.get().add(chart);
   }
   private static final DateTimeFormat dateTimeFormat = DateTimeFormat.getFormat("yyyy-MM-dd");
   private long getTime(String date) {
      return dateTimeFormat.parse(date).getTime();
   }
}
Result
Verify the result.
gwt_highcharts_line_charts.htm

Advertisements