- GWT Highcharts - Home
- GWT Highcharts - Overview
- Environment Setup
- Configuration Syntax
- GWT Highcharts - Line Charts
- GWT Highcharts - Area Charts
- GWT Highcharts - Bar Charts
- GWT Highcharts - Column Charts
- GWT Highcharts - Pie Charts
- GWT Highcharts - Scatter Chart
- GWT Highcharts - Dynamic Charts
- GWT Highcharts - Combinations
- GWT Highcharts - 3D Charts
- GWT Highcharts - Map Charts
- GWT Highcharts Useful Resources
- GWT Highcharts - Quick Guide
- GWT Highcharts - Useful Resources
- GWT Highcharts - Discussion
Selected Reading
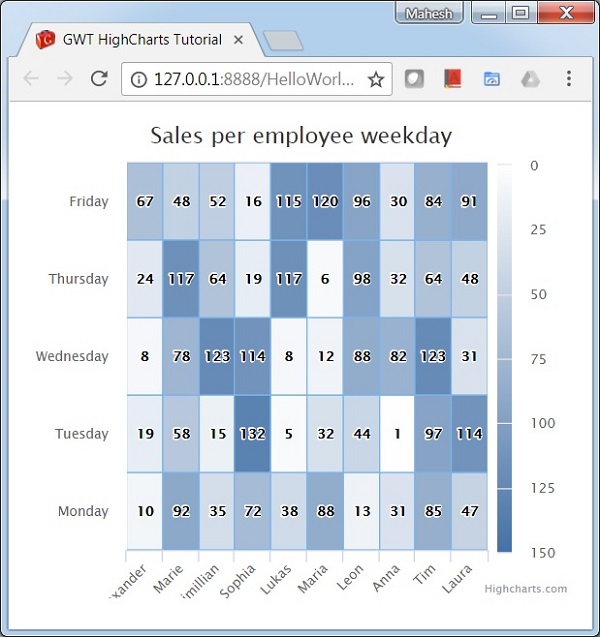
GWT Highcharts - Heat Map Chart
Following is an example of a Heat Map Chart.
We have already seen the configuration used to draw a chart in Highcharts Configuration Syntax chapter.
An example of a Heat Map Chart is given below.
Configurations
Let us now see the additional configurations/steps taken.
chart
Configure the chart type to be 'heatmap' based. chart.type decides the series type for the chart. Here, the default value is "line".
chart.setType(Type.HEATMAP);
Example
HelloWorld.java
package com.tutorialspoint.client;

import org.moxieapps.gwt.highcharts.client.Chart;
import org.moxieapps.gwt.highcharts.client.ColorAxis;
import org.moxieapps.gwt.highcharts.client.Legend;
import org.moxieapps.gwt.highcharts.client.Series;
import org.moxieapps.gwt.highcharts.client.Style;
import org.moxieapps.gwt.highcharts.client.ToolTip;
import org.moxieapps.gwt.highcharts.client.ToolTipData;
import org.moxieapps.gwt.highcharts.client.ToolTipFormatter;
import org.moxieapps.gwt.highcharts.client.labels.DataLabels;
import org.moxieapps.gwt.highcharts.client.plotOptions.HeatmapPlotOptions;

import com.google.gwt.core.client.EntryPoint;
import com.google.gwt.user.client.ui.RootPanel;

public class HelloWorld implements EntryPoint {
   public void onModuleLoad() {
      final Chart chart = new Chart()
         .setType(Series.Type.HEATMAP)
         .setMarginTop(40)
         .setMarginBottom(40)
         .setChartTitleText("Sales per employee weekday");

      chart.getXAxis()
         .setCategories("Alexander", "Marie", "Maximillian", "Sophia", "Lukas", "Maria", "Leon", "Anna", "Tim", "Laura");

      chart.getYAxis()
         .setCategories("Monday", "Tuesday", "Wednesday", "Thursday", "Friday")
         .setAxisTitle(null);

      chart.setColorAxis(new ColorAxis()
         .setMin(0)
         .setMinColor("#FFFFFF")
         .setMaxColor("#4572A7")
      );

      chart.setLegend(new Legend()
         .setAlign(Legend.Align.RIGHT)
         .setLayout(Legend.Layout.VERTICAL)
         .setMargin(0)
         .setVerticalAlign(Legend.VerticalAlign.TOP)
         .setY(25)
         .setSymbolHeight(320)
      );

      chart.setToolTip(new ToolTip()
         .setFormatter(new ToolTipFormatter() {
            @Override
            public String format(ToolTipData toolTipData) {
               return toolTipData.getPoint().getValue() + " items on ";
            }
         })
      );

      chart.addSeries(chart.createSeries()
         .setOption("borderWidth", 1)
         .setName("Sales per employee")
         .setPlotOptions(new HeatmapPlotOptions()
            .setDataLabels(new DataLabels()
               .setEnabled(true)
               .setColor("#000000")
               .setStyle(new Style()
                  .setOption("textShadow", "none")
                  .setOption("HcTextStroke", null)
               )
            )
         )
         .setPoints(new Number[][]{
            {0, 0, 10}, {0, 1, 19}, {0, 2, 8}, {0, 3, 24}, {0, 4, 67},
            {1, 0, 92}, {1, 1, 58}, {1, 2, 78}, {1, 3, 117}, {1, 4, 48},
            {2, 0, 35}, {2, 1, 15}, {2, 2, 123}, {2, 3, 64}, {2, 4, 52},
            {3, 0, 72}, {3, 1, 132}, {3, 2, 114}, {3, 3, 19}, {3, 4, 16},
            {4, 0, 38}, {4, 1, 5}, {4, 2, 8}, {4, 3, 117}, {4, 4, 115},
            {5, 0, 88}, {5, 1, 32}, {5, 2, 12}, {5, 3, 6}, {5, 4, 120},
            {6, 0, 13}, {6, 1, 44}, {6, 2, 88}, {6, 3, 98}, {6, 4, 96},
            {7, 0, 31}, {7, 1, 1}, {7, 2, 82}, {7, 3, 32}, {7, 4, 30},
            {8, 0, 85}, {8, 1, 97}, {8, 2, 123}, {8, 3, 64}, {8, 4, 84},
            {9, 0, 47}, {9, 1, 114}, {9, 2, 31}, {9, 3, 48}, {9, 4, 91}
         })
      );
      RootPanel.get().add(chart);
   }
}
Result
Verify the result.
gwt_highcharts_map_charts.htm

Advertisements