- GWT Highcharts - Home
- GWT Highcharts - Overview
- Environment Setup
- Configuration Syntax
- GWT Highcharts - Line Charts
- GWT Highcharts - Area Charts
- GWT Highcharts - Bar Charts
- GWT Highcharts - Column Charts
- GWT Highcharts - Pie Charts
- GWT Highcharts - Scatter Chart
- GWT Highcharts - Dynamic Charts
- GWT Highcharts - Combinations
- GWT Highcharts - 3D Charts
- GWT Highcharts - Map Charts
- GWT Highcharts Useful Resources
- GWT Highcharts - Quick Guide
- GWT Highcharts - Useful Resources
- GWT Highcharts - Discussion
Selected Reading
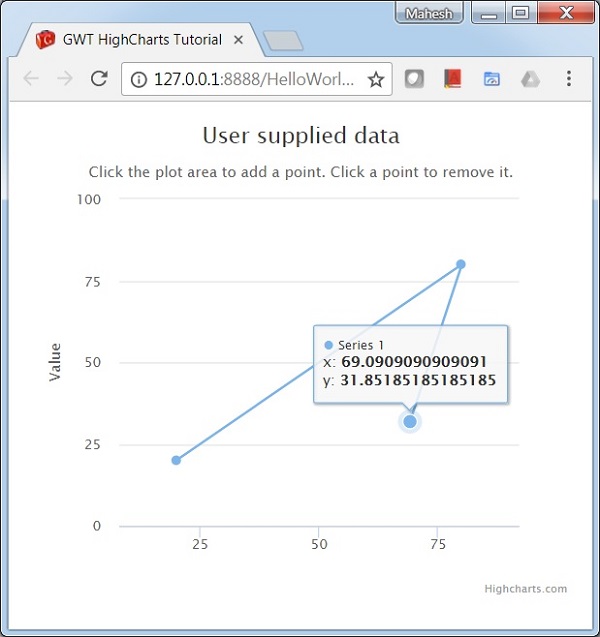
Chart with Point Addition Capability
We have already seen the configuration used to draw a chart in Highcharts Configuration Syntax chapter.
An example of a Chart with point addition capability is given below.
Configurations
Let us now see the additional configurations/steps taken.
chart.events
Add a click method to the chart.event property. This method adds a new point using the x, y co-ordinate of the clicked area in the chart to the series.
chart.setClickEventHandler(new ChartClickEventHandler() {
   @Override
   public boolean onClick(ChartClickEvent chartClickEvent) {
      series.addPoint(chartClickEvent.getXAxisValue(), chartClickEvent.getYAxisValue());
      return true;
   }
});
Example
HelloWorld.java
package com.tutorialspoint.client;

import java.util.Date;

import org.moxieapps.gwt.highcharts.client.Chart;
import org.moxieapps.gwt.highcharts.client.Credits;
import org.moxieapps.gwt.highcharts.client.Exporting;
import org.moxieapps.gwt.highcharts.client.Legend;
import org.moxieapps.gwt.highcharts.client.Series;
import org.moxieapps.gwt.highcharts.client.ToolTip;
import org.moxieapps.gwt.highcharts.client.ToolTipData;
import org.moxieapps.gwt.highcharts.client.ToolTipFormatter;
import org.moxieapps.gwt.highcharts.client.YAxis;

import org.moxieapps.gwt.highcharts.client.events.ChartClickEvent;
import org.moxieapps.gwt.highcharts.client.events.ChartClickEventHandler;
import org.moxieapps.gwt.highcharts.client.events.PointClickEvent;
import org.moxieapps.gwt.highcharts.client.events.PointClickEventHandler;
import org.moxieapps.gwt.highcharts.client.Series.Type;

import org.moxieapps.gwt.highcharts.client.labels.DataLabels;
import org.moxieapps.gwt.highcharts.client.plotOptions.BarPlotOptions;
import org.moxieapps.gwt.highcharts.client.plotOptions.SeriesPlotOptions;

import com.google.gwt.core.client.EntryPoint;
import com.google.gwt.i18n.client.DateTimeFormat;
import com.google.gwt.i18n.client.NumberFormat;
import com.google.gwt.user.client.Random;
import com.google.gwt.user.client.Timer;
import com.google.gwt.user.client.ui.RootPanel;

public class HelloWorld implements EntryPoint {
   public void onModuleLoad() {
      final Chart chart = new Chart()
         .setType(Series.Type.SCATTER)
         .setMargin(70, 50, 60, 80)
         .setChartTitleText("User supplied data")
         .setChartSubtitleText("Click the plot area to add a point. Click a point to remove it.")
         .setExporting(new Exporting()
            .setEnabled(false)
         )
         .setLegend(new Legend()
            .setEnabled(false)
         );

         chart.getXAxis()
            .setMinPadding(0.2)
            .setMaxPadding(0.2)
            .setMaxZoom(60);

         final YAxis yAxis = chart.getYAxis();
         yAxis.setAxisTitleText("Value")
            .setMinPadding(0.2)
            .setMaxPadding(0.2)
            .setMaxZoom(60)
            .setPlotLines(yAxis.createPlotLine()
               .setValue(0)
               .setWidth(1)
               .setColor("#808080")
            );

         final Series series = chart.createSeries()
            .setPoints(new Number[][] {{20, 20}, {80, 80}});
         chart.addSeries(series);

         chart.setClickEventHandler(new ChartClickEventHandler() {
            @Override
            public boolean onClick(ChartClickEvent chartClickEvent) {
               series.addPoint(chartClickEvent.getXAxisValue(), chartClickEvent.getYAxisValue());
               return true;
            }
         });

         chart.setSeriesPlotOptions(new SeriesPlotOptions()
            .setLineWidth(1)
            .setPointClickEventHandler(new PointClickEventHandler() {
               @Override
               public boolean onClick(PointClickEvent pointClickEvent) {
                  Series series = chart.getSeries(pointClickEvent.getSeriesId());
                  if(series.getPoints().length > 1) {
                     pointClickEvent.getPoint().remove();
                  }
                  return true;
               }}
            )
         );
      RootPanel.get().add(chart);
   }
}
Result
Verify the result.
gwt_highcharts_dynamic_charts.htm

Advertisements