- GWT Highcharts - Home
- GWT Highcharts - Overview
- Environment Setup
- Configuration Syntax
- GWT Highcharts - Line Charts
- GWT Highcharts - Area Charts
- GWT Highcharts - Bar Charts
- GWT Highcharts - Column Charts
- GWT Highcharts - Pie Charts
- GWT Highcharts - Scatter Chart
- GWT Highcharts - Dynamic Charts
- GWT Highcharts - Combinations
- GWT Highcharts - 3D Charts
- GWT Highcharts - Map Charts
- GWT Highcharts Useful Resources
- GWT Highcharts - Quick Guide
- GWT Highcharts - Useful Resources
- GWT Highcharts - Discussion
Stacked and Grouped Column Chart
Following is an example of a stacked and grouped Column Chart.
We have already seen the configuration used to draw a chart in Highcharts Configuration Syntax chapter. Let us now see additional configurations and also how we have added stacking attribute in plotoptions.
An example of a stacked and grouped Column Chart is given below.
plotOptions
The plotOptions is a wrapper object for configurations objects for each series type. The configuration objects for each series can also be overridden for each series item as given in the series array. This is to stack the values of each series on top of each other. This is to stack the values of each series on top of each other.
Configure the stacking of the chart using plotOptions.column.stacking as "normal". Possible values are null which disables stacking, "normal" stacks by value and "percent" stacks the chart by percentages.
chart.setColumnPlotOptions(new ColumnPlotOptions()
   .setStacking(Stacking.NORMAL)
);
series
Configure the stack of each series to identity the group of the series.
chart.addSeries(chart.createSeries()
   .setName("John")
   .setPoints(new Number[] {5, 3, 4, 7, 2})
   .setStack("male")
);
Example
HelloWorld.java
package com.tutorialspoint.client;

import org.moxieapps.gwt.highcharts.client.Chart;
import org.moxieapps.gwt.highcharts.client.Series.Type;
import org.moxieapps.gwt.highcharts.client.plotOptions.ColumnPlotOptions;
import org.moxieapps.gwt.highcharts.client.plotOptions.PlotOptions.Stacking;

import com.google.gwt.core.client.EntryPoint;
import com.google.gwt.user.client.ui.RootPanel;

public class HelloWorld implements EntryPoint {
   public void onModuleLoad() {
      final Chart chart = new Chart()
         .setType(Type.COLUMN)
         .setChartTitleText("Total fruit consumption, grouped by gender")
         .setColumnPlotOptions(new ColumnPlotOptions()
            .setStacking(Stacking.NORMAL)
         );

      chart.getXAxis()
         .setCategories("Apples", "Oranges", "Pears", "Grapes", "Bananas");

      chart.getYAxis()
         .setAllowDecimals(false)
         .setMin(0)
         .setAxisTitleText("Number of fruits");

      chart.addSeries(chart.createSeries()
         .setName("John")
         .setPoints(new Number[] {5, 3, 4, 7, 2})
         .setStack("male")
      );
      chart.addSeries(chart.createSeries()
         .setName("Joe")
         .setPoints(new Number[] {3, 4, 4, 2, 5})
         .setStack("male")
      );
      chart.addSeries(chart.createSeries()
         .setName("Jane")
         .setPoints(new Number[] {2, 2, 3, 2, 1})
         .setStack("female")
      );
      chart.addSeries(chart.createSeries()
         .setName("Janet")
         .setPoints(new Number[] {3, 0, 4, 4, 3})
         .setStack("female")
      );
      RootPanel.get().add(chart);
   }
}
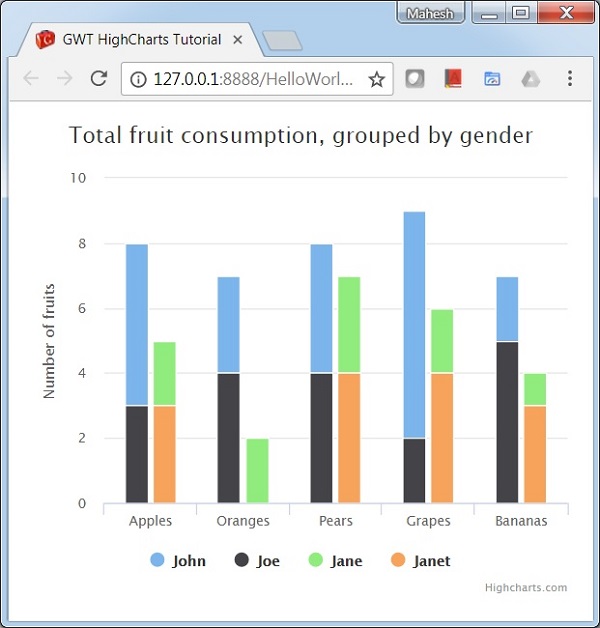
Result
Verify the result.